

Reports
Elorus Reports let you monitor your business’s financial performance in real time. The financial data displayed in the reports is based on the records you’ve entered and the documents you’ve issued.
Reports are organized into the following categories:
- Sales
- Expenses & purchases
- Time tracking
- General (Client & supplier balances, Products/Services report)
- Cash Flow (Payments received and Payments sent)
- Accounting (Revenue/Expenses, Taxes)
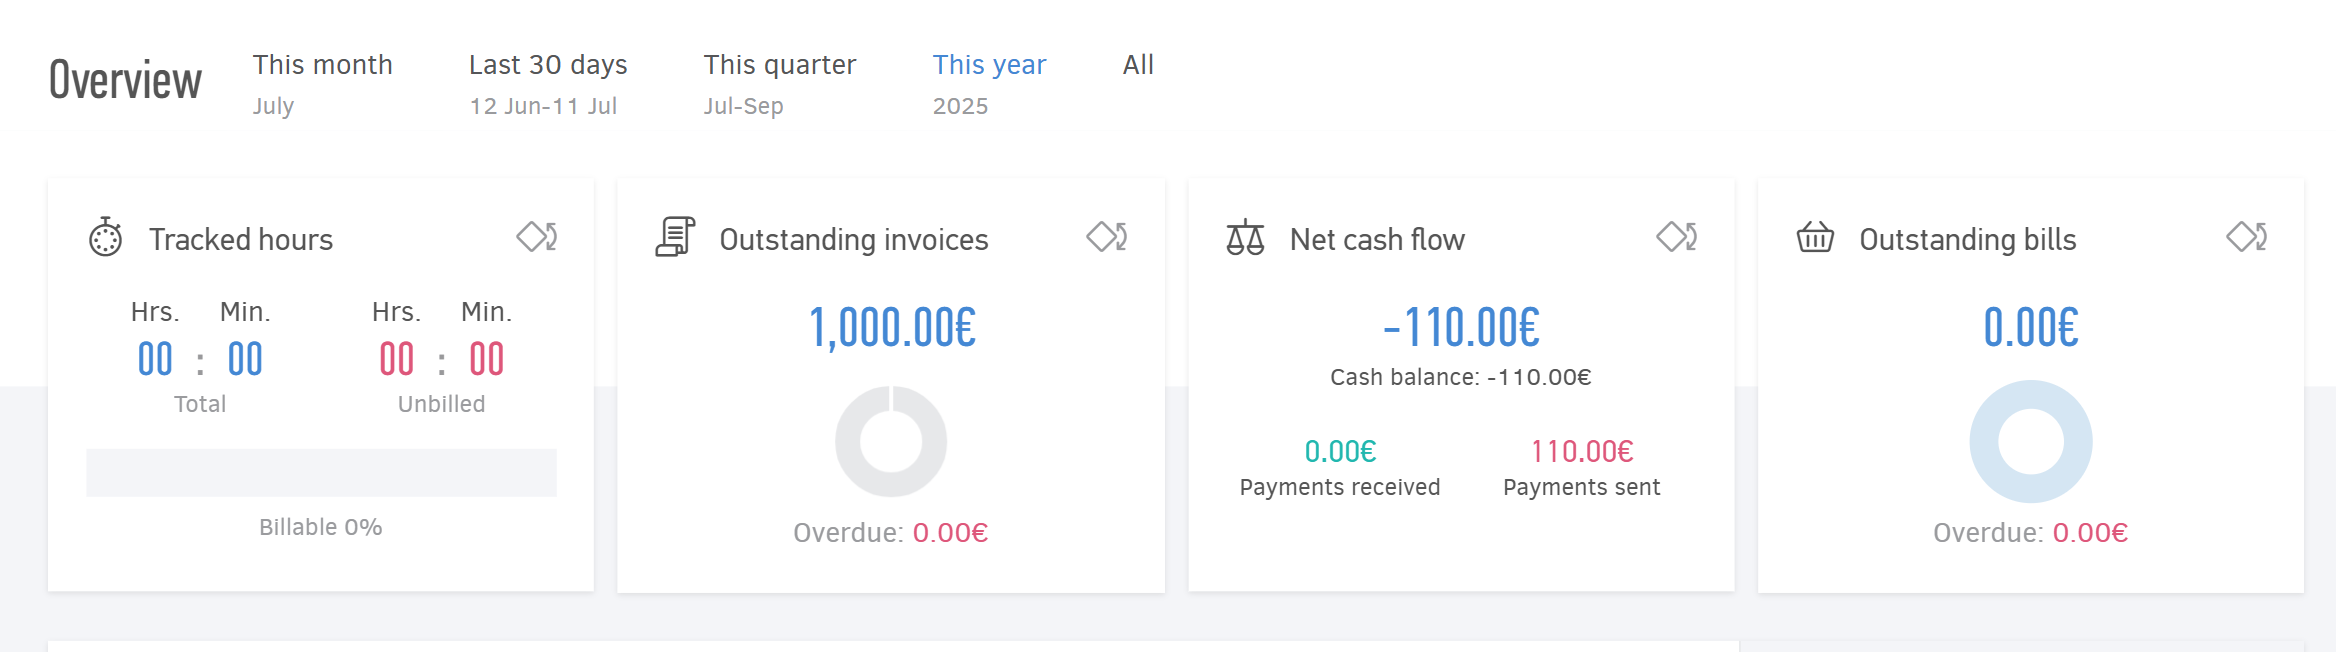
On the Organization overview page you can get a quick snapshot of your financials through widgets and charts.
To view all available reports and dive into detailed insights, go to the main menu and click Reports > All reports.
Managing reports
Customization
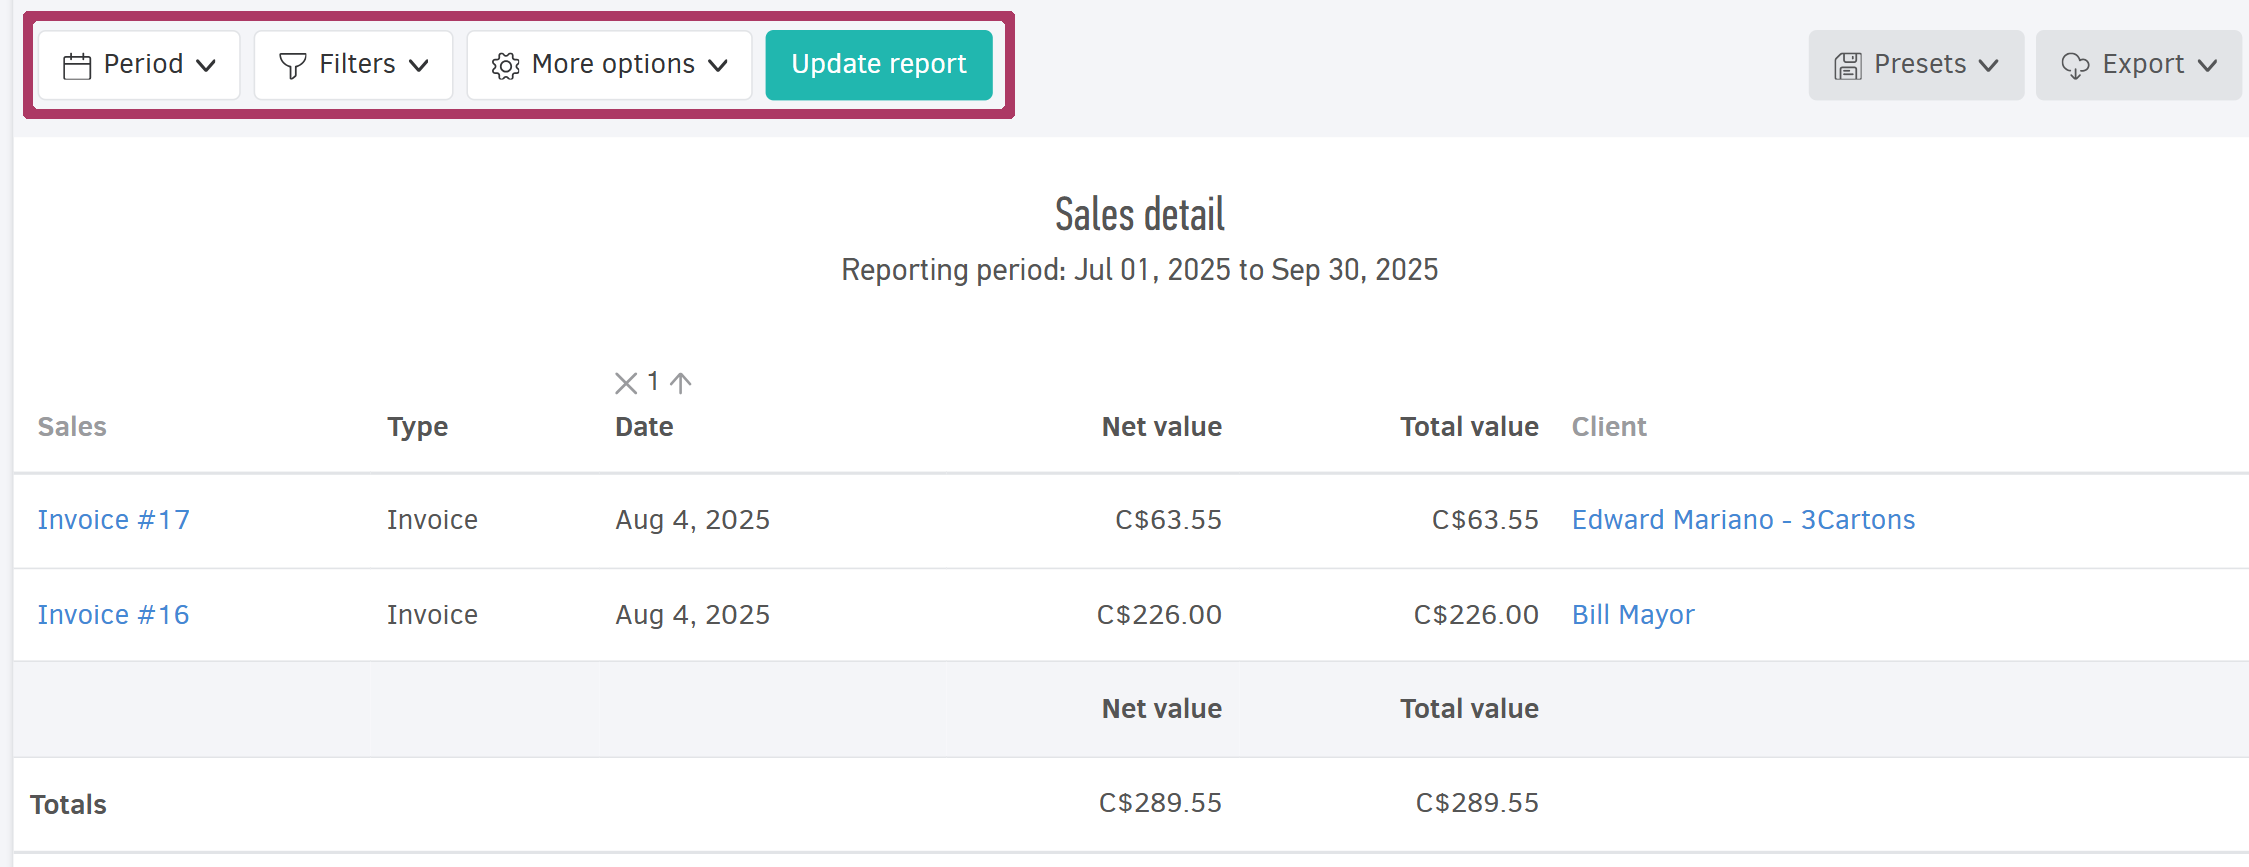
Reports are fully customizable to meet your needs. You can adjust the Period, apply Filters, and configure the Columns through the Options menu.
The Period can be set to predefined options (Today, Current month, Last year, etc.) or you can define an Absolute or Relative period.
In the Filters, you can choose from options, such as document Status (Paid, Unpaid, etc.), Client, Document Type, Currency, and more.
The Options section allows you to group results by specific criteria (Date, Month, Document type, categories etc.) so you can track relevant subsets for each group.
Use the Group results by month option to view monthly breakdowns of your sales, expenses, and other key business figures.
After customizing a report, click Update report to view the results.
Presets
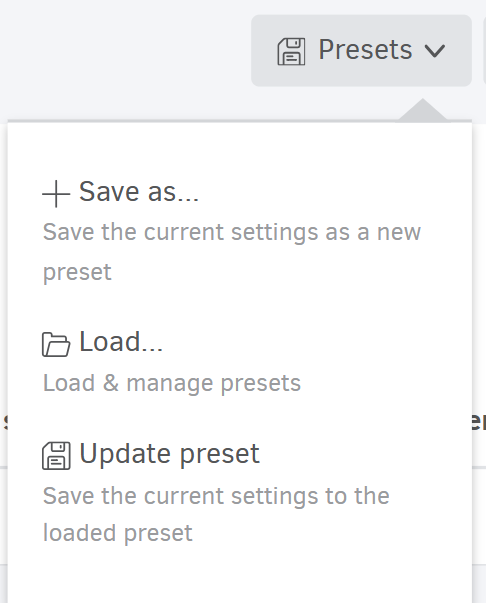
You can save your current settings by clicking Save as. This allows you to easily retrieve them later.
When you select Save as, you’ll be prompted to give your configuration a Title and optionally a Description.
Each Preset stores:
- The selected period (including relative dates like last month or absolute dates),
For flexibility, prefer using relative periods (e.g. Last 6 months) when saving report settings.
- Any filters you’ve applied,
- Your preferred Columns and layout,
- Grouping options used for result breakdowns
To view and manage your report presets, click Load. From the list, click a title to open that report, or use the pencil icon to edit or the trash icon to delete.
If you make changes to a saved report, you can update it by clicking Presets > Update preset.
This feature is available with select Elorus Complete plans.
Export
You can download any report in Excel or PDF format by clicking Export.
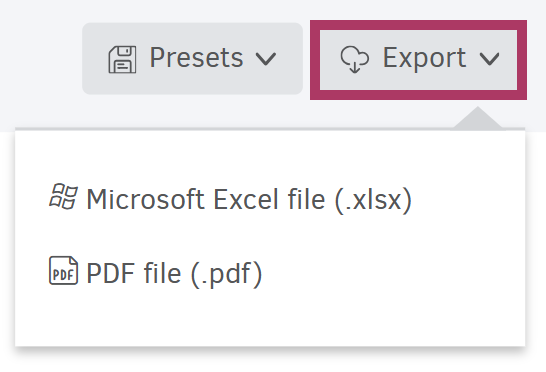
The files will be saved to your default download folder, which is configured in your browser settings (Chrome, Mozilla, Safari, etc.). For more information, visit the relevant article.
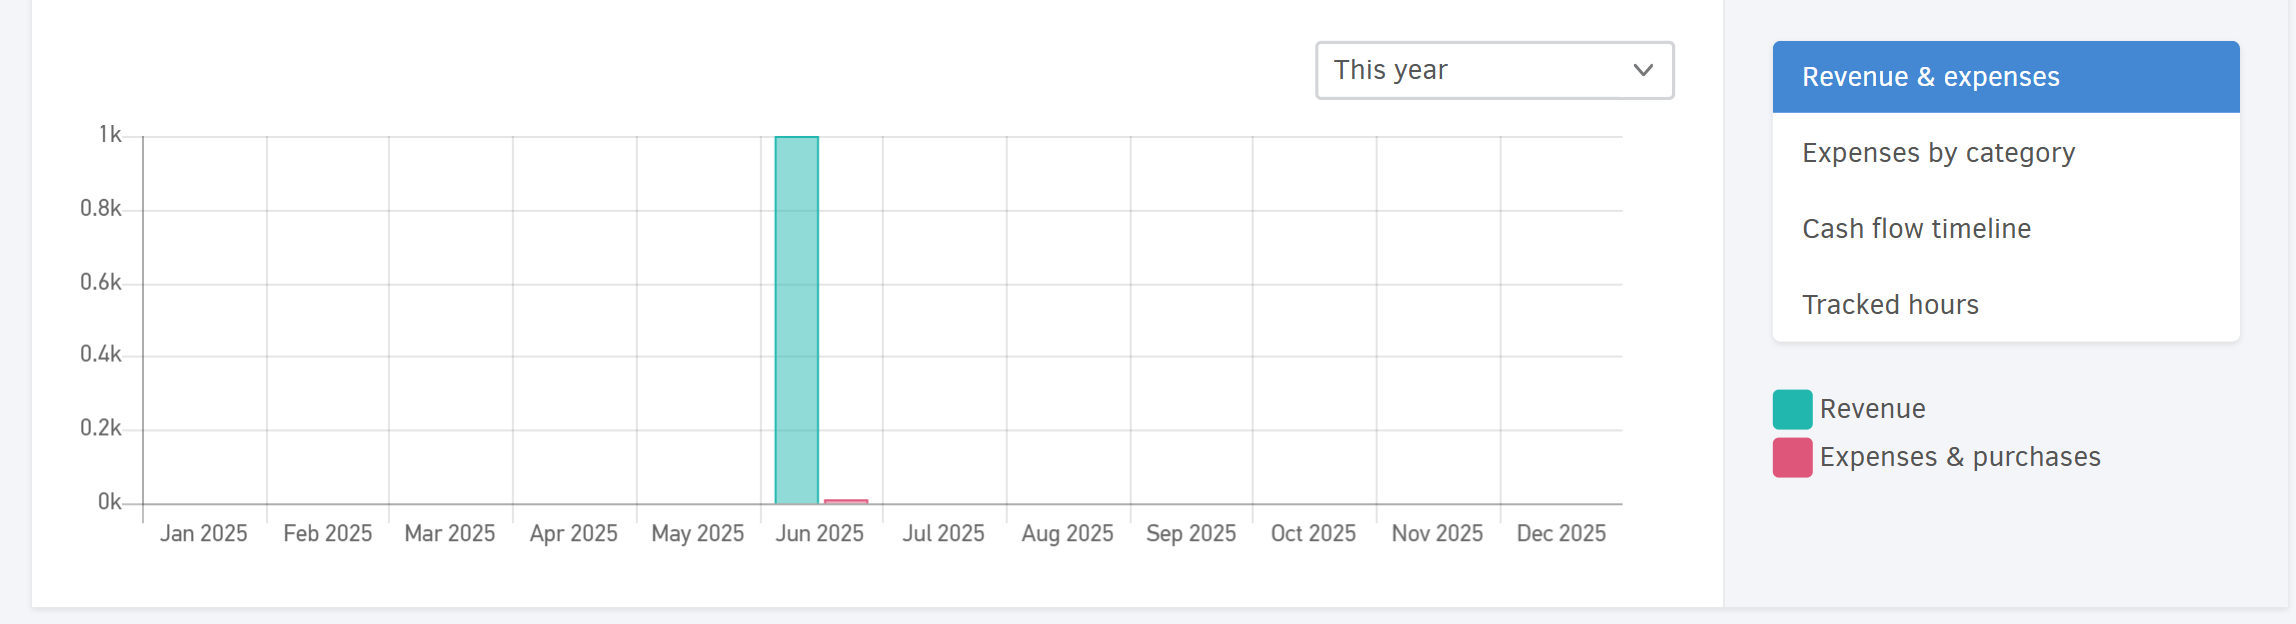
Dashboards
Dashboards are summary reports that present data visually through graphs and charts. They help you identify financial trends and assess your business performance at a glance.
Dashboards are divided into the following categories:
-
Sales dashboard
-
Expenses & purchases dashboard
-
Team productivity
-
Cash flow dashboard
To access, click on Dashboards from the main menu.
Like reports, dashboards allow you to set a Period, and apply Filters for more targeted insights.
For a detailed explanation of each dashboard, refer to the related article.