Adjust your reports
- 22 Jun 2023
- Contributors


Adjust your reports
- Updated on 22 Jun 2023
- Contributors
Article summary
Did you find this summary helpful?
Thank you for your feedback!
Elorus creates detailed reports based on the data you have entered. Reports offer a complete picture of your financial activity for a given period and type of transaction. You can choose from a wide range of reports that will help you make decisions regarding your team's performance and your business's financial result.
Note: In case you wish to obtain reports for transactions under multiple currencies, please check.
Reporting in elorus becomes available the moment you start adding data, e.g. creating invoices. You can view reports for all kinds of records. They are grouped by relevance inside Reports -> All reports . These groups are Accounting, Sales, Expenses and Purchases, Cash flow, Time tracking and General. Additionally, you can personalize the level of detail and additional information that appears.
The options are presented below with the help of three examples that help you remain on top of your finances. For more information on the time tracking and project reports you can view the individual articles.
Example A: Period selection - Expenses by category
1. Period Selection: Custom
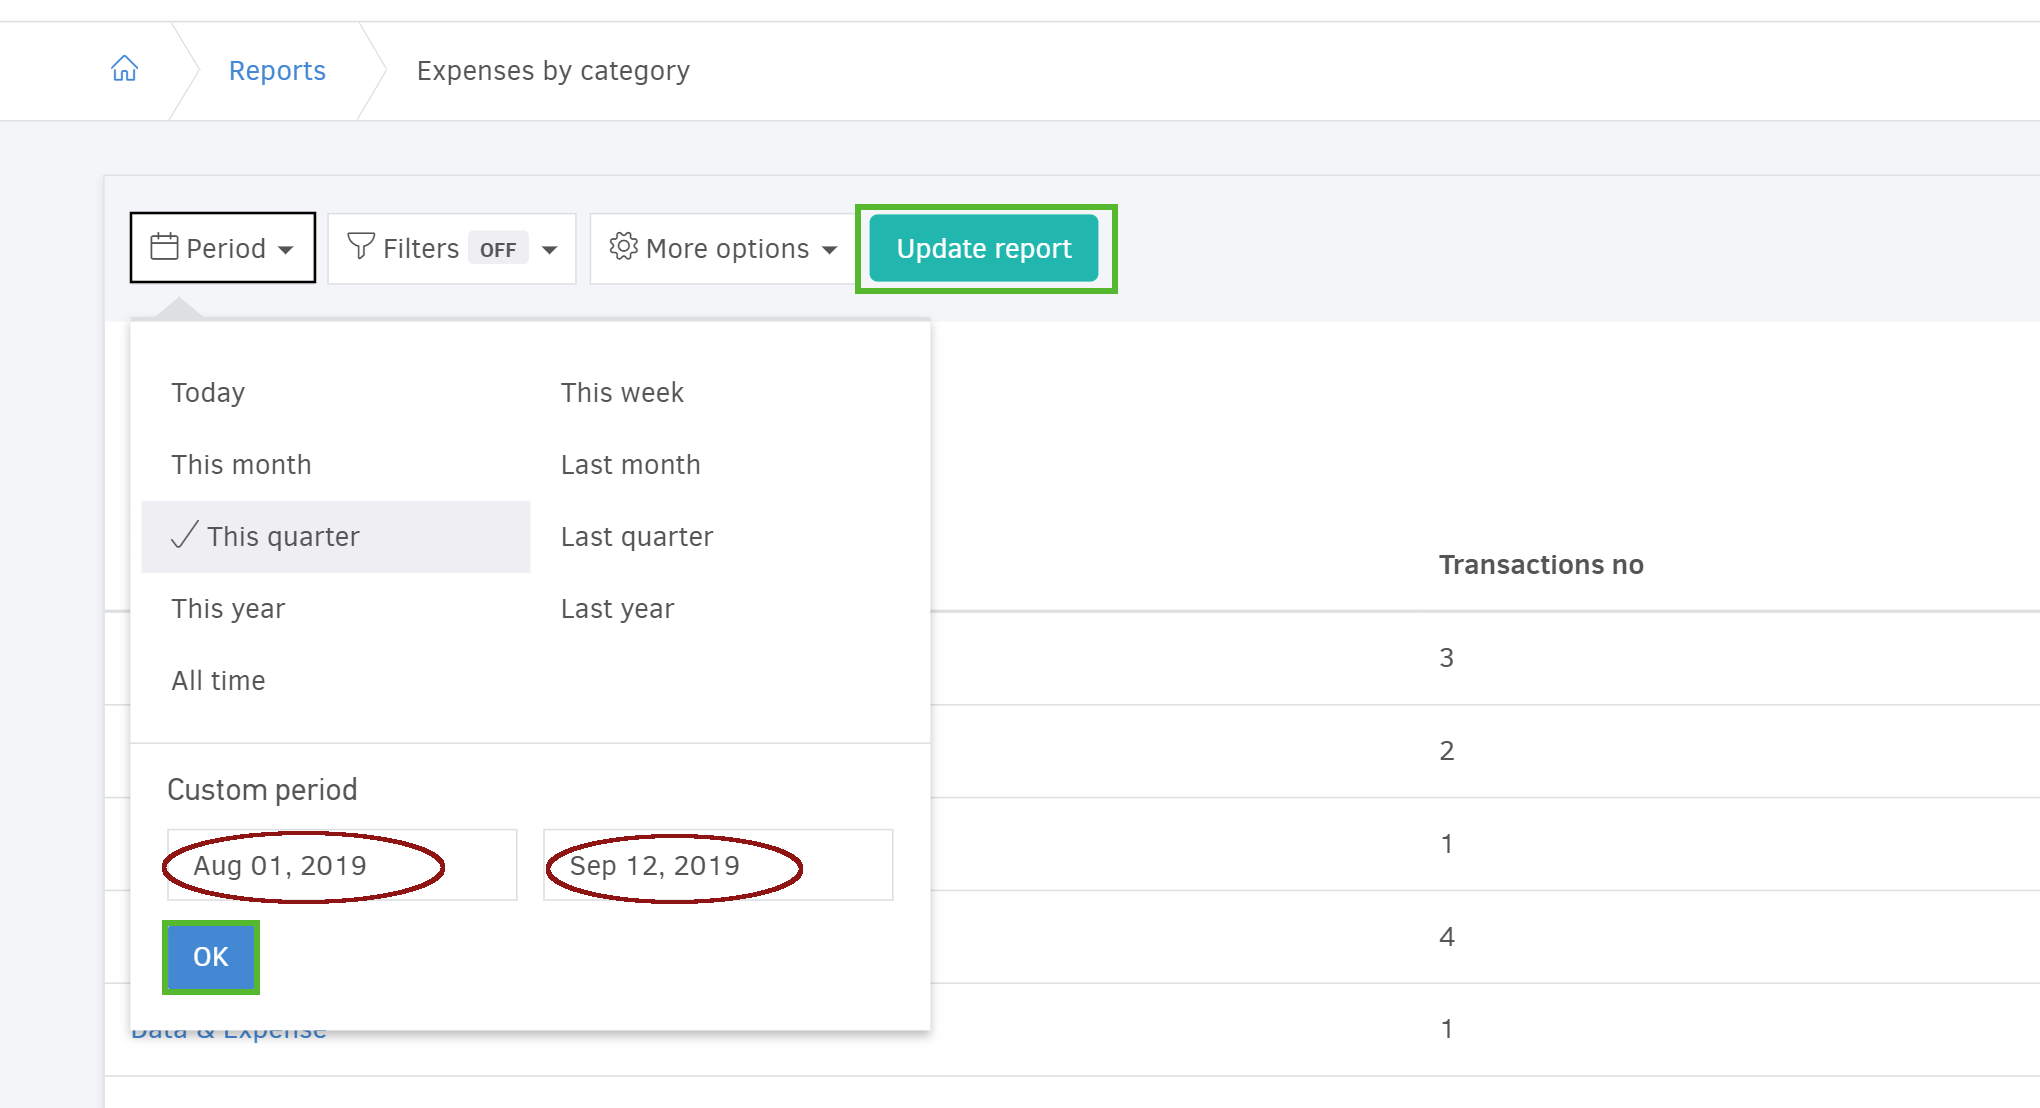
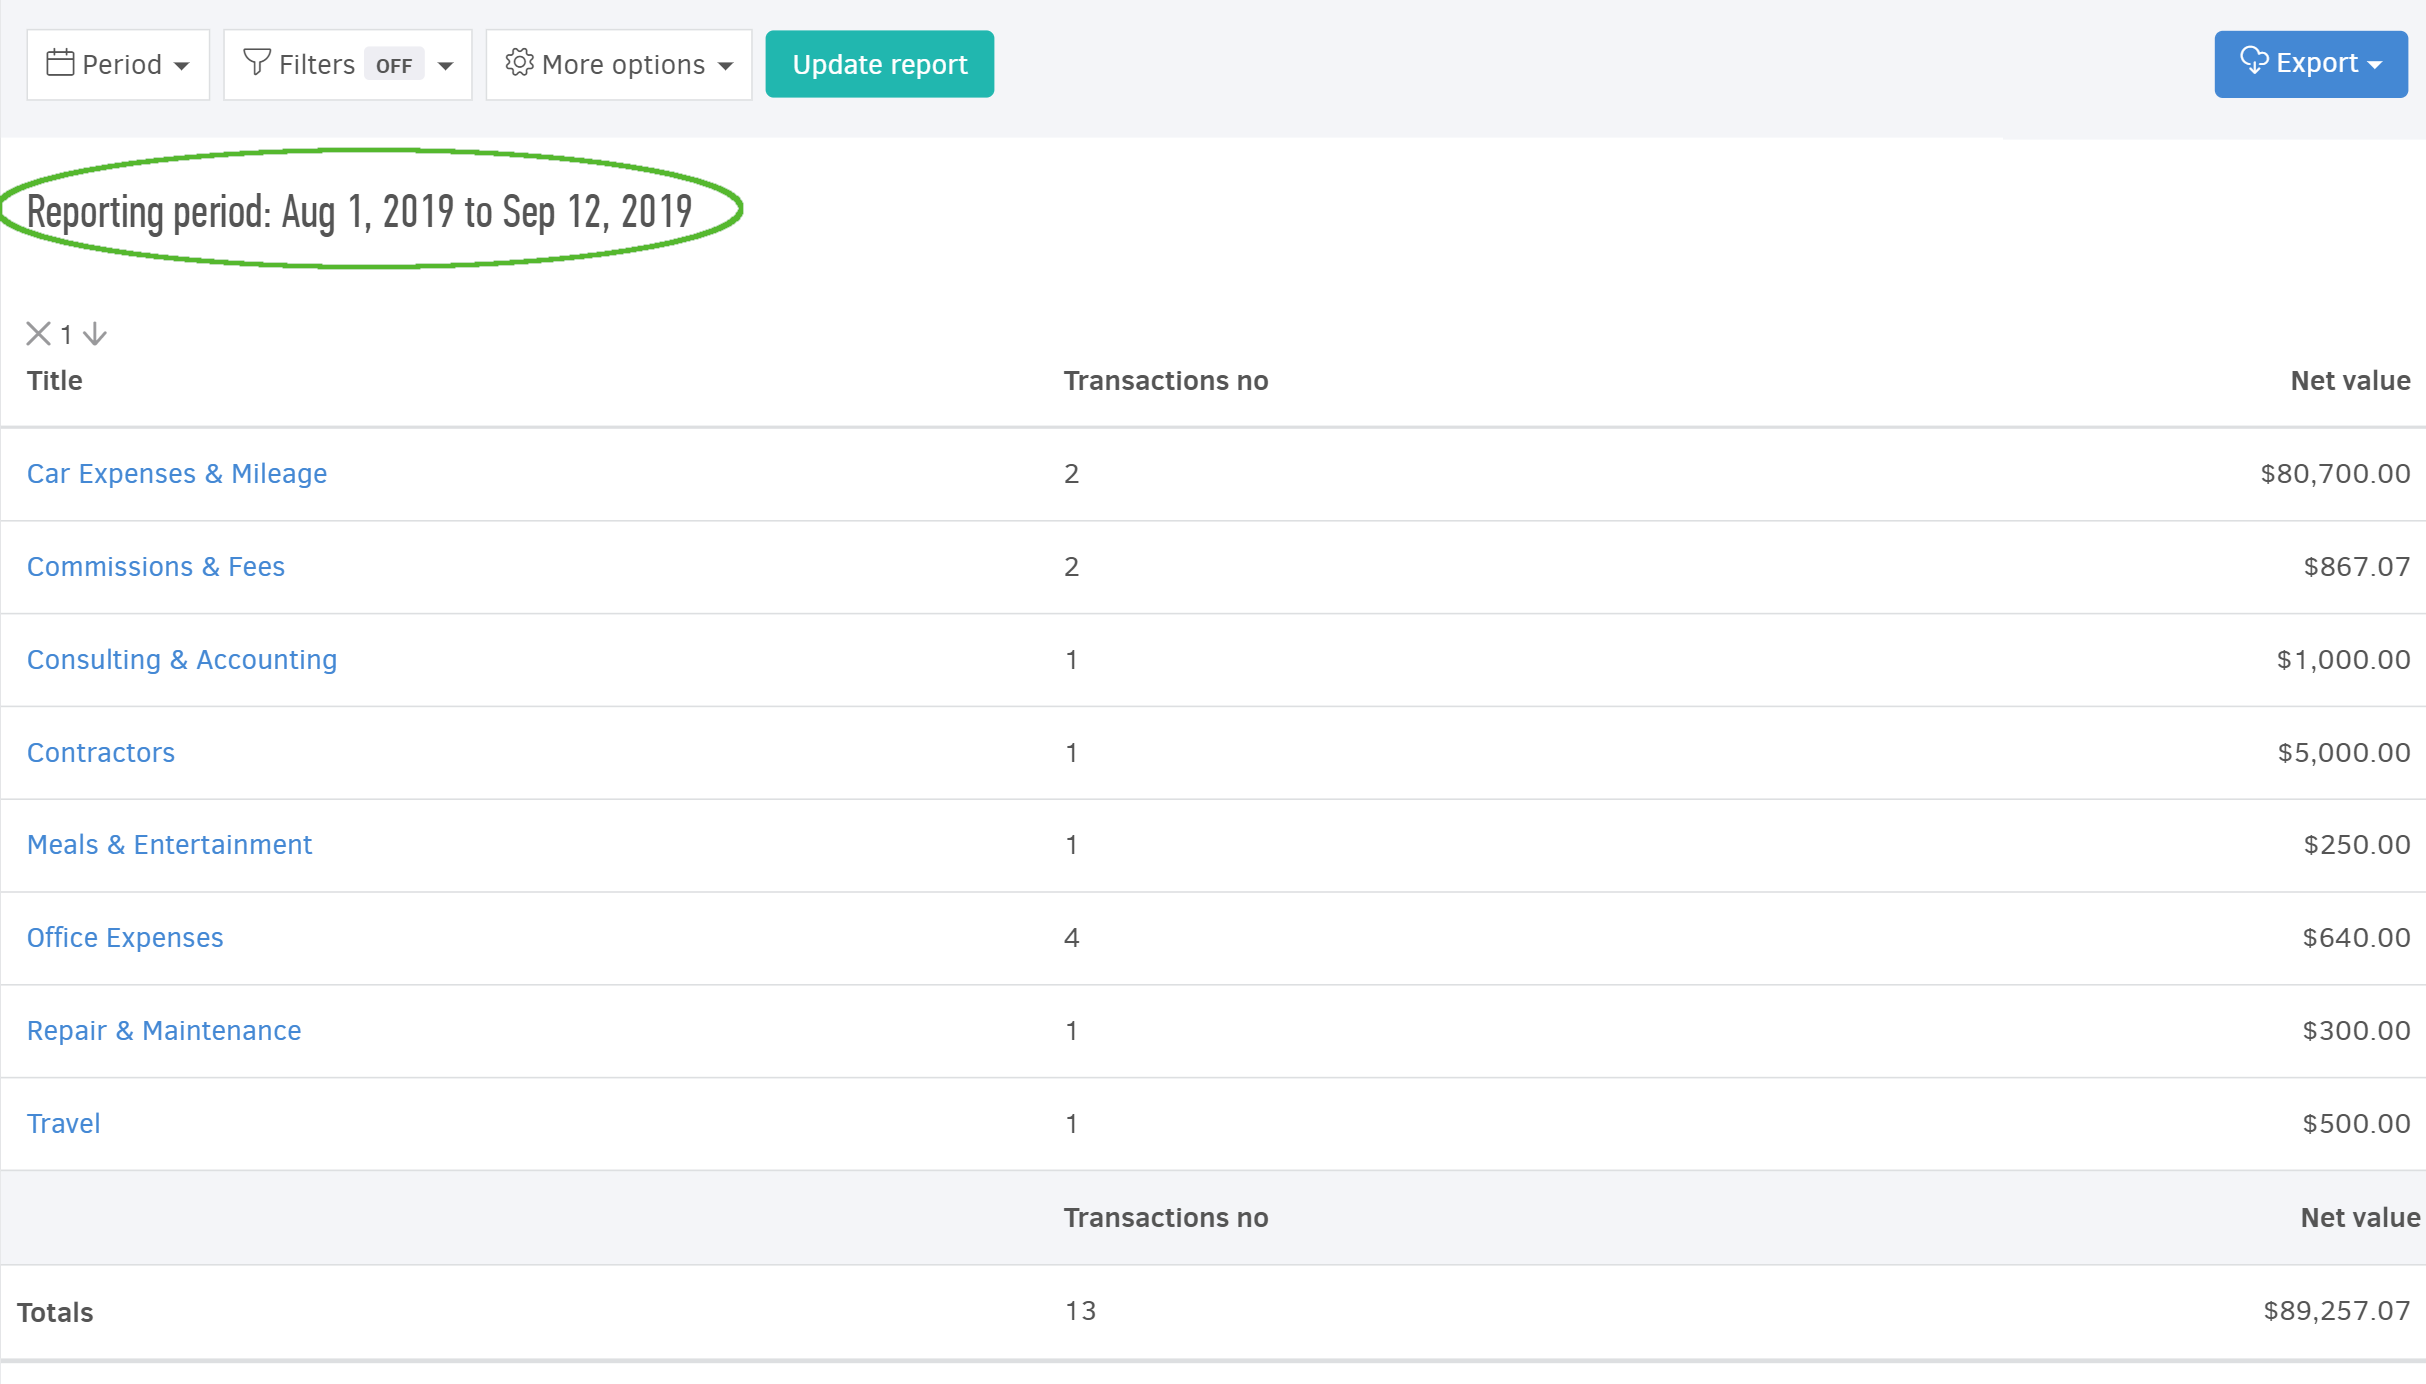
2. Result
Elorus has prepared some interesting stats for you: Your expenses and purchases per category, for a specified period of time. This allows you to figure where you spend the most at one glance. Finally, you can see what the total expenses were.
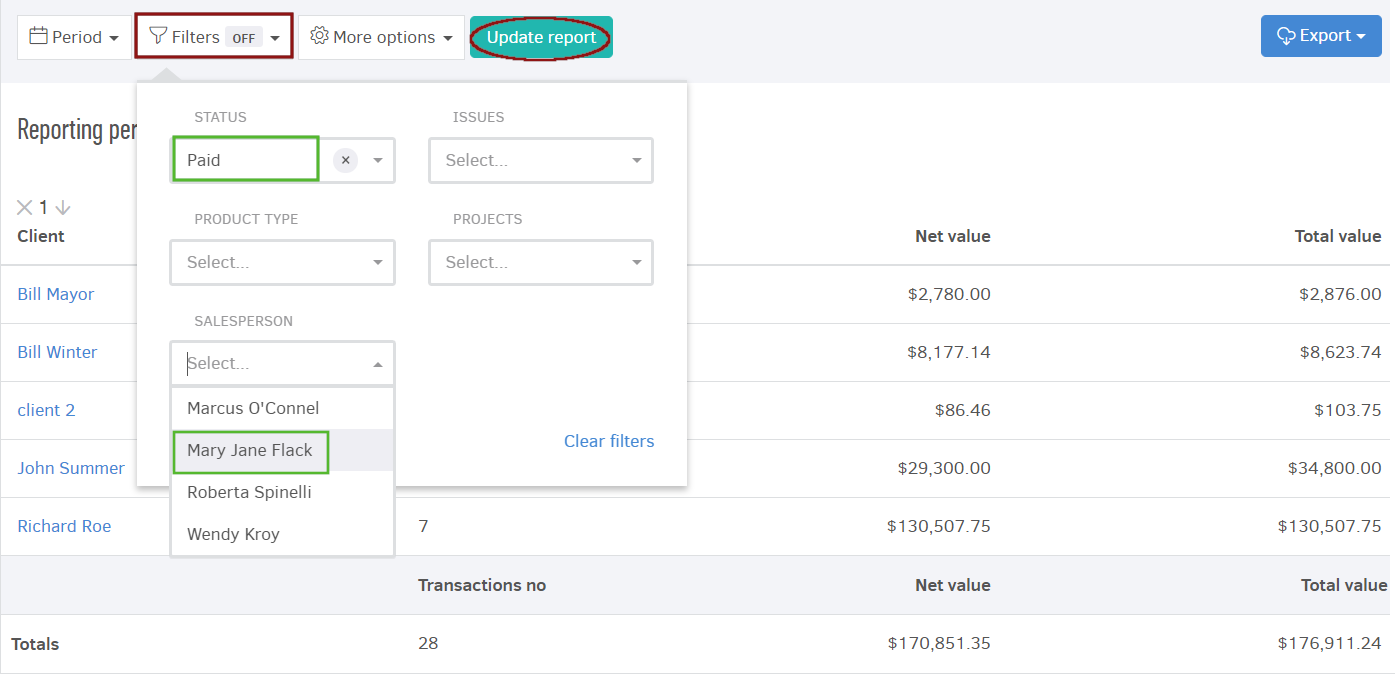
Example B: Period and Filters-Sales by client
1. Period button
This quarter is the selected interval, for which the sales by client will appear on the report.
2. Filter selection
Here you can select between one or more filters. 'Status' indicates the payment state of invoices. By selecting "Paid" the invoice amounts that have already been paid will be the only ones shown in the table. As for the salesperson, this is due to the applied tracking category of the same name - that salesman is going to determine which clients and sales will appear, for the time period defined in the step above.
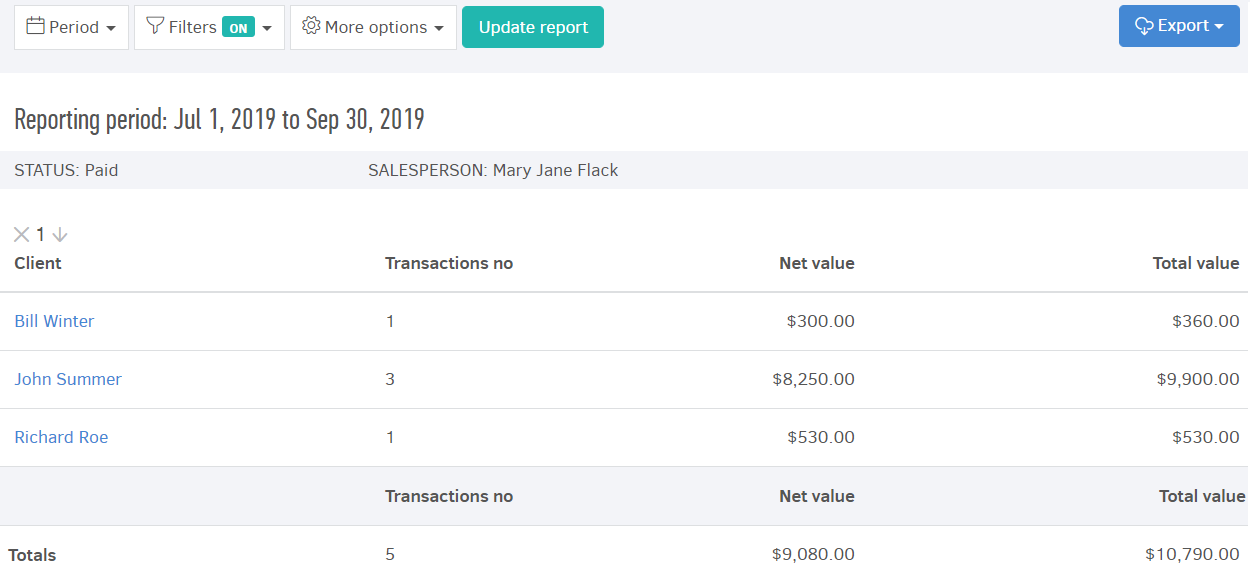
3. Result
By applying the above filter you can see exactly how much money has cashed-in already with the success of a particular salesperson, for the period of time of your choice.
Example C: Period and Options - Payments received detail
1. Period button
"This month" is selected as the interval we wish to examine.
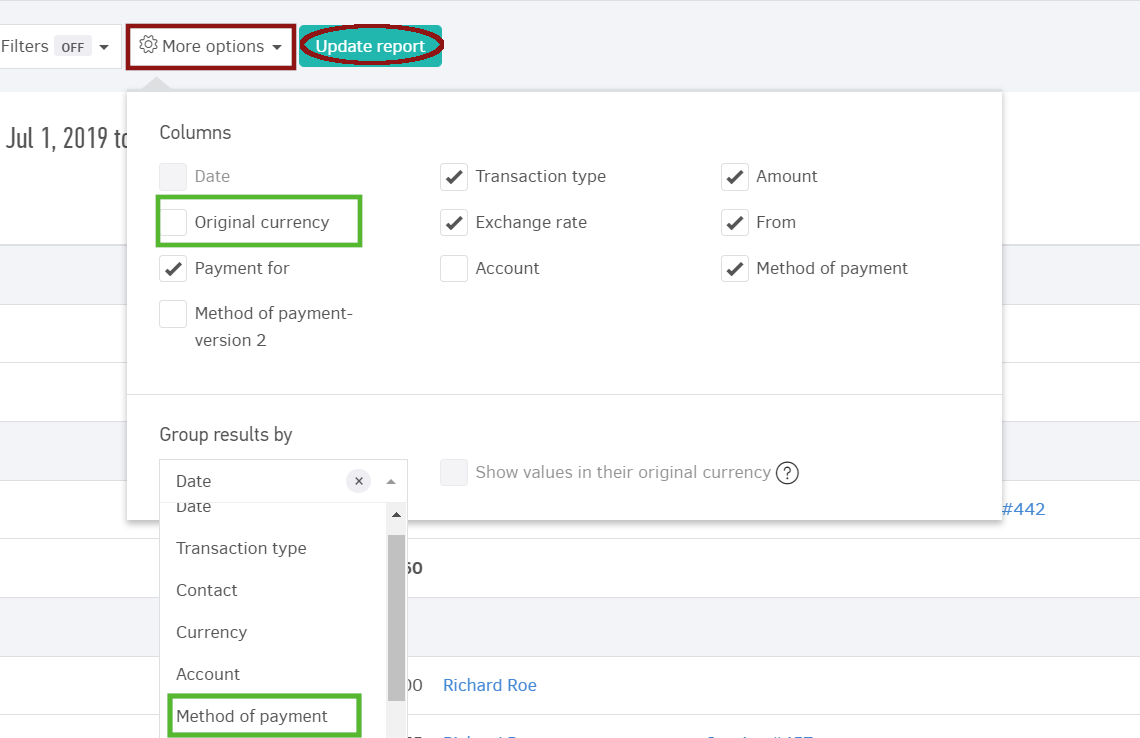
2. More options
The button can be utilized to adjust the columns that appear on the table as well as group the lines with the data that suit your needs. In the example, the "method of payment" determines the grouping. You can view the steps in the image below: clicking "update report" is always the last step, as it is the one that ensures your changes are applied.
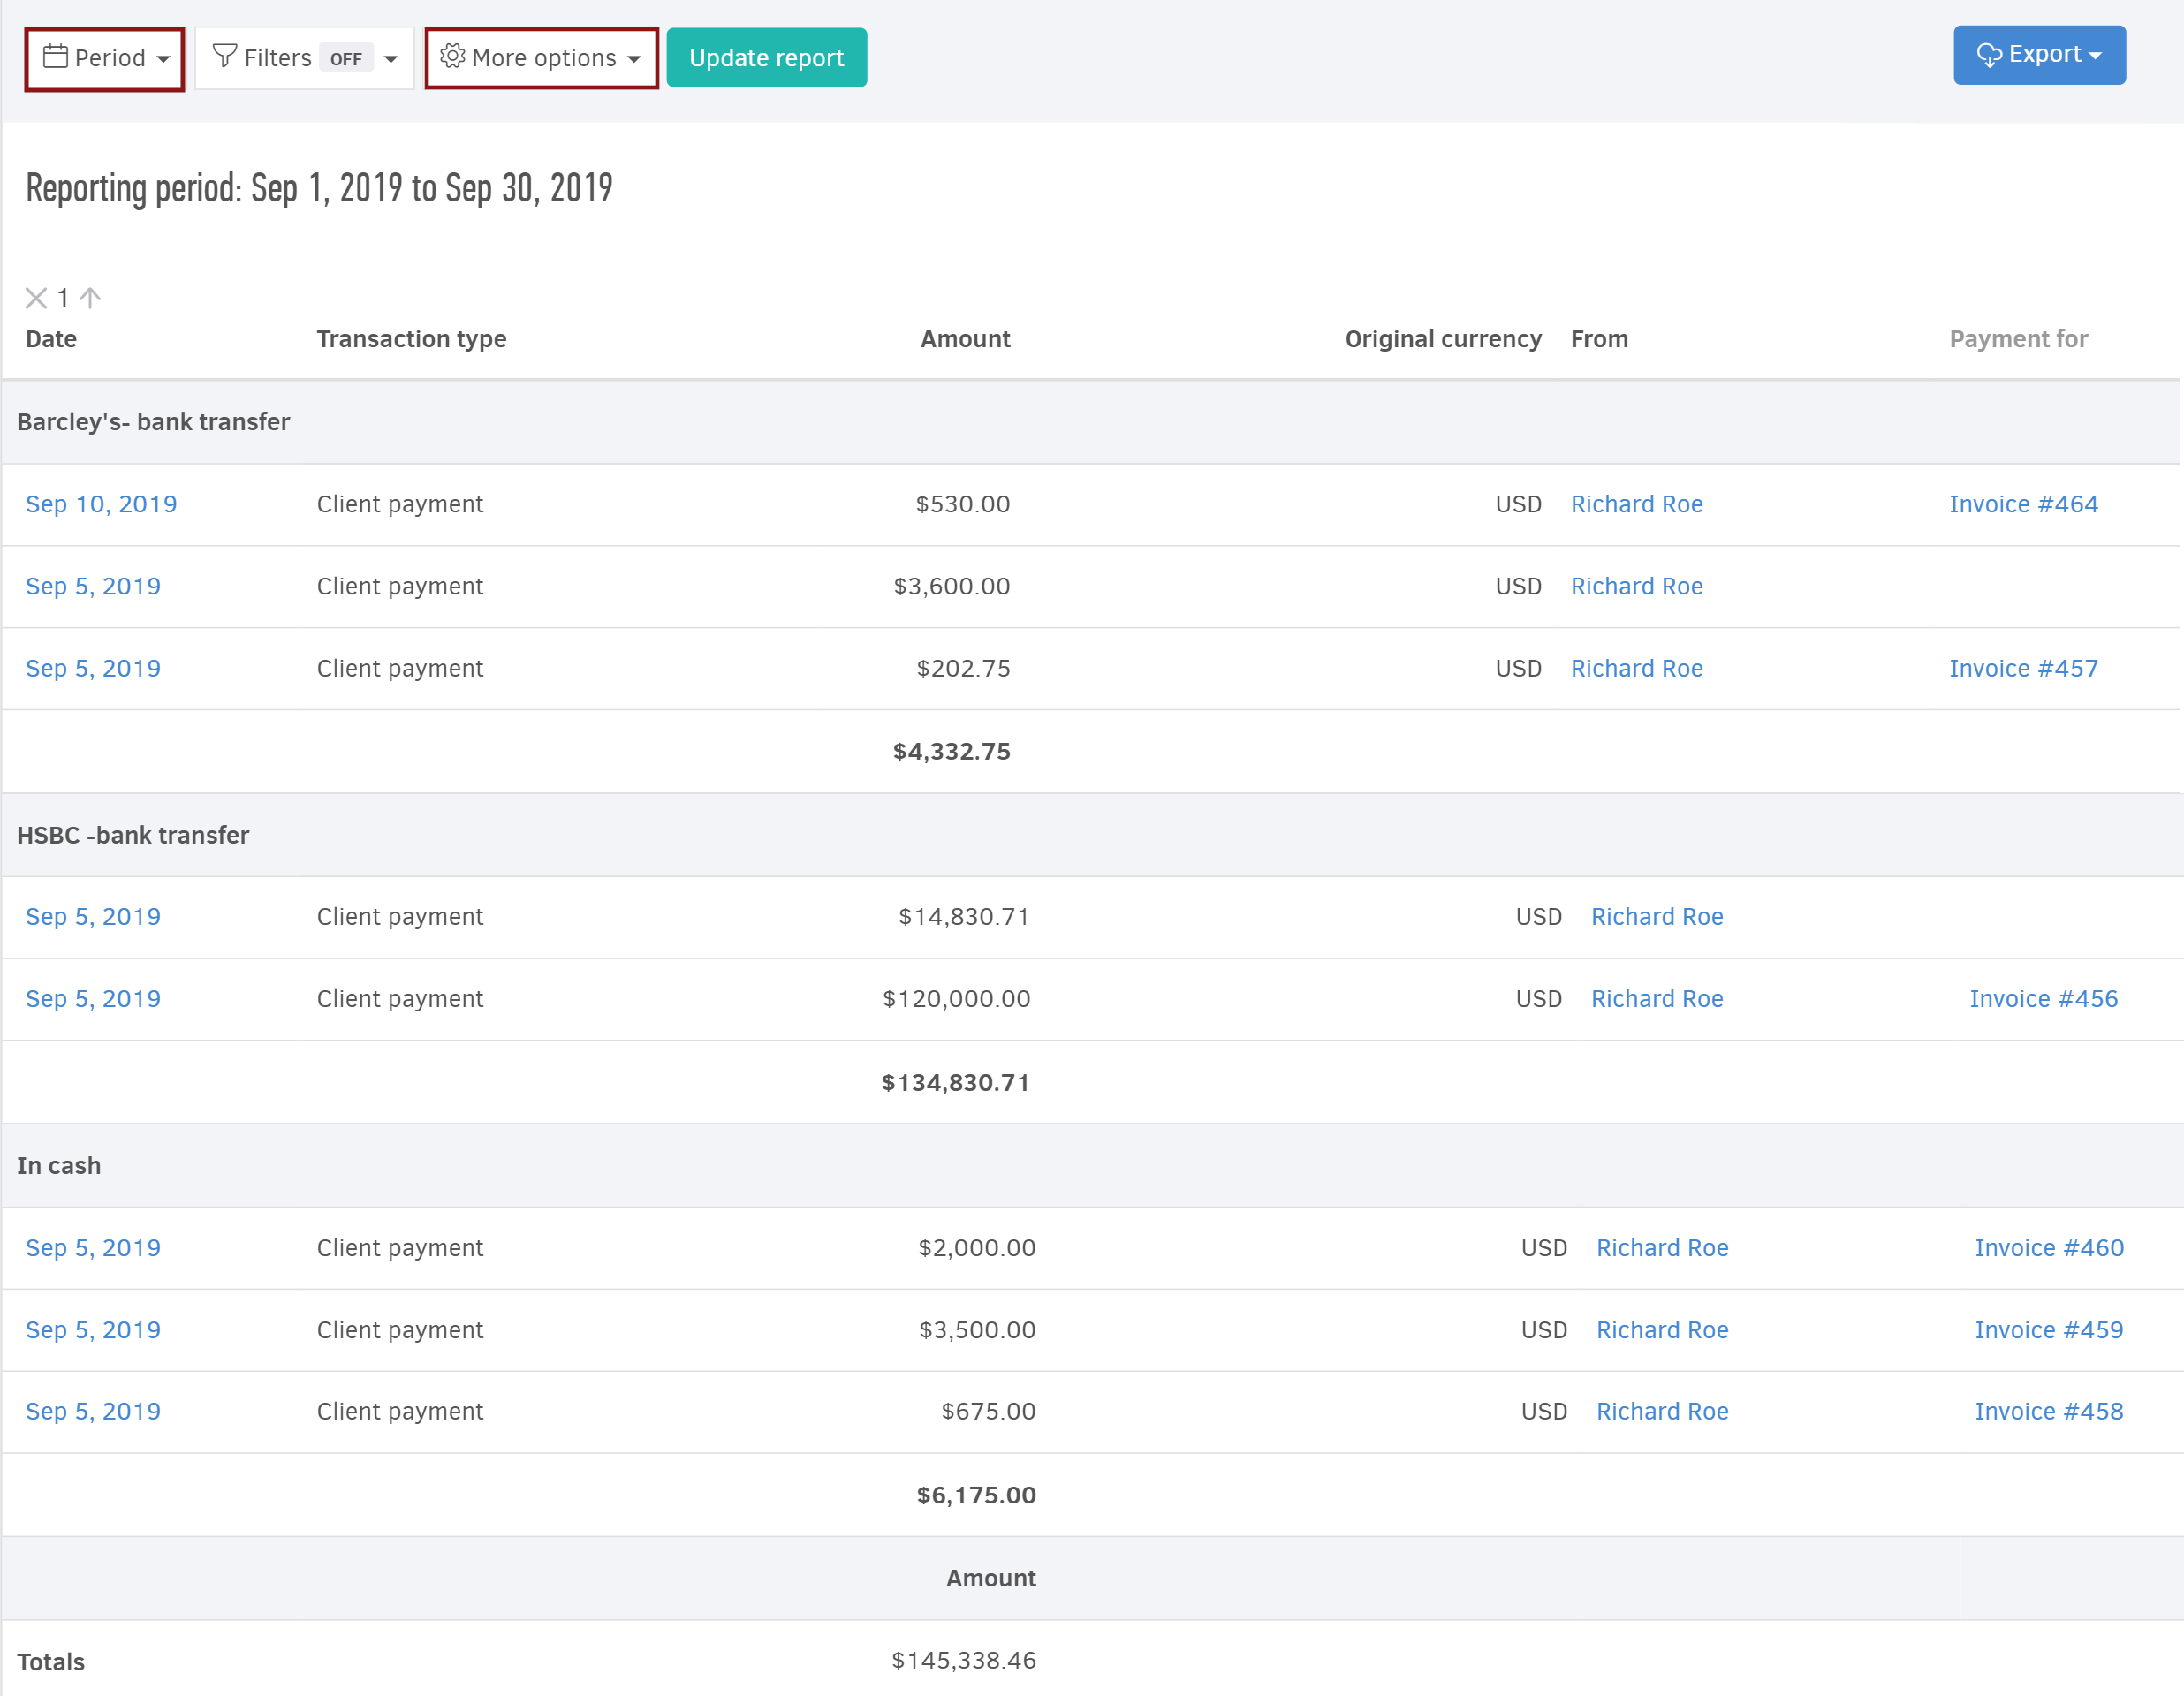
3. Result a
A full, detailed appearance of all payments you have for the set period of time in reverse time order. The list of payments per date is grouped by bank, so you can have a total of how much money you will find in each of your business accounts. The original currency, client received from, along with the invoice used for the payment, if any, all appear as attributes in the table.
4. Result-modifying view
As well as selecting the data you need, you can also choose which of them will come first. For example, you can view the different payments in date order, (example above). However, this is not restrictive: You can as well select any of the columns in bold. In the image below, amount is selected last, making it the variable that determines the row of appearance of the records on the table,
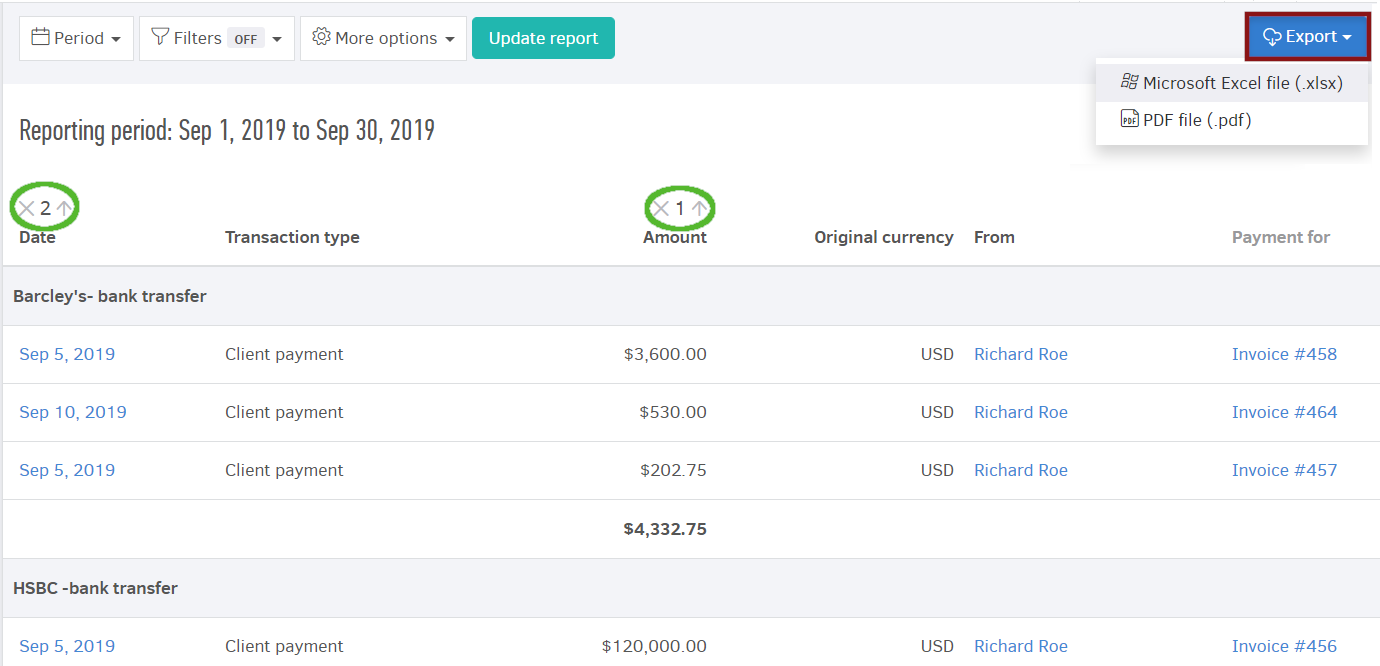
Click 'Export' to get the report on your computer/portable device in excel or pdf file.
Was this article helpful?