This report category gives you a complete overview of your business expenses. It includes entries recorded via the Expenses menu, as well as entries added under Bills (...More > Bills).
The available reports in this category are:
-
Expenses and purchases detail: Displays every entry created through the Expenses, Bills, and Supplier credits.
-
Expenses & purchases by tracking category: Provides a summary of all transactions grouped by each tracking category you have created.
-
Purchases by supplier: Presents a summary of your expenses and purchases by supplier. Note that this report excludes any expense entries not linked to a supplier.
-
Expenses by category: Groups expenses and purchases based on the expense categories you've assigned.
To access these reports, go to Reports > All reports from the main menu and select the one you need.
For detailed guidance on how to manage reports, see the related article.
Below are a few examples of how to use the Expenses & Purchases reports.
Expenses & purchases detail
To access this report quickly, go to Reports > Detailed expenses & purchases.
How to view a detailed overview of outstanding purchase invoices for a specific period?
After selecting your desired Period (e.g. This year), use the Status filter and choose Unpaid.
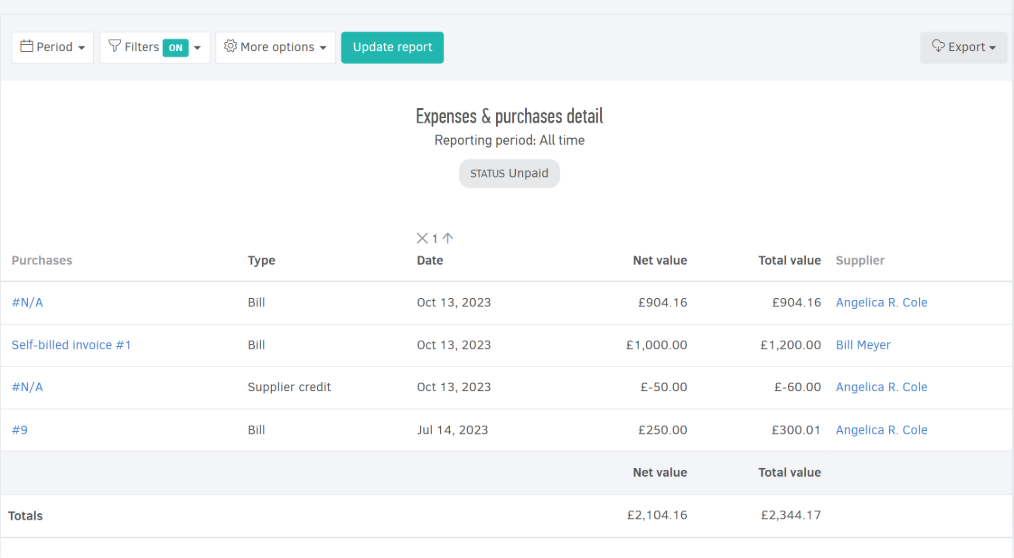
Using this report (e.g. by saving results for 2-3 different time periods) can help identify recurring unpaid bills.
Expenses & purchases by tracking category
This report lets you track your spending based on the tracking categories you've created.
For example, if you've set up a tracking category called "Expenses by department" with options such as R&D, Sales, and Marketing, this report will give you a clear breakdown of total expenses per department for a specified period.
![]()
You can further analyze the results by clicking any row to open the Expenses & purchases detail report for that specific category.
If you have more than one tracking category, you can switch between them using the tabs at the top of the report.
Purchases by supplier
How to find out which suppliers I work with most often?
This report shows the number of transactions, net and total values, and supplier details (clicking a supplier’s name).
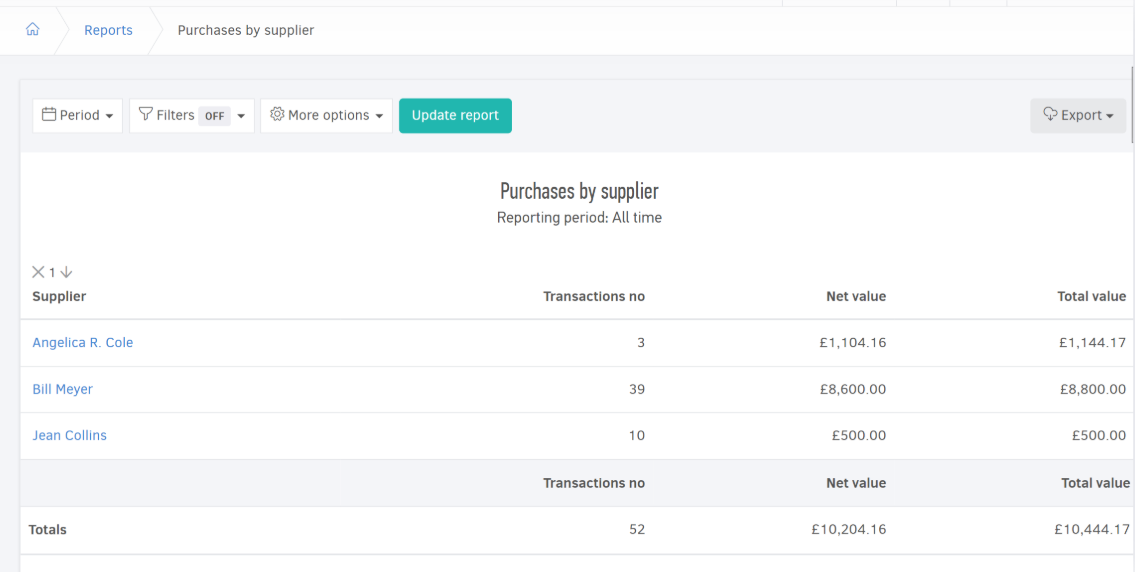
In the example provided, the most frequent supplier is Bill Meyer.
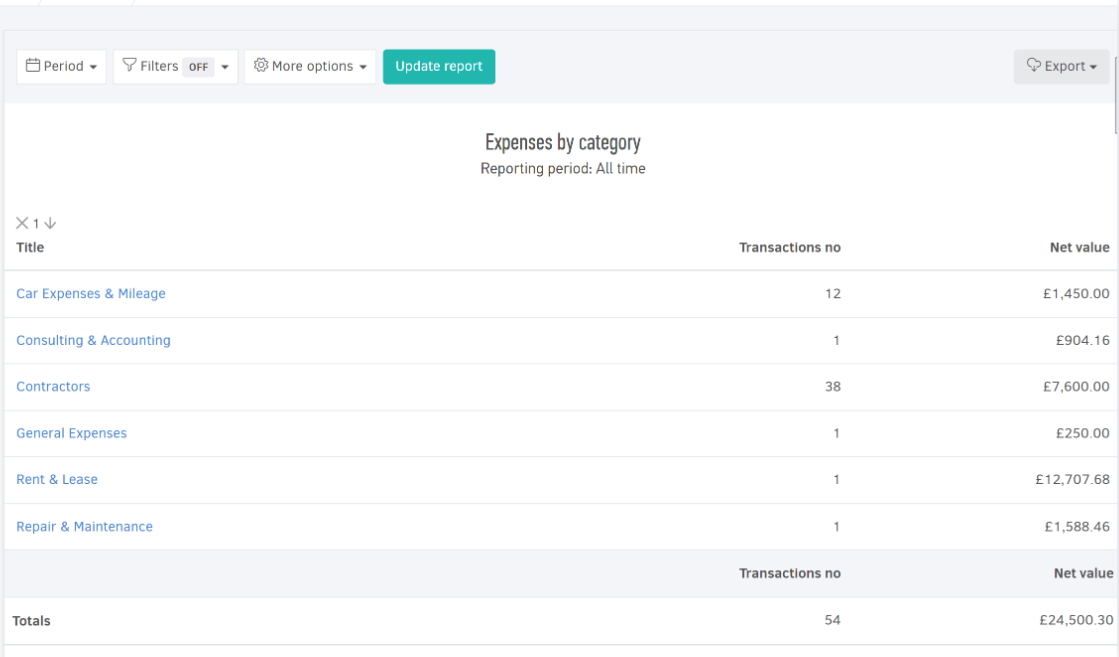
Expenses by category
How to identify where I spend the most?
This report displays the categories in which you’ve spent the most, based on both the net amount and the frequency of each transaction.
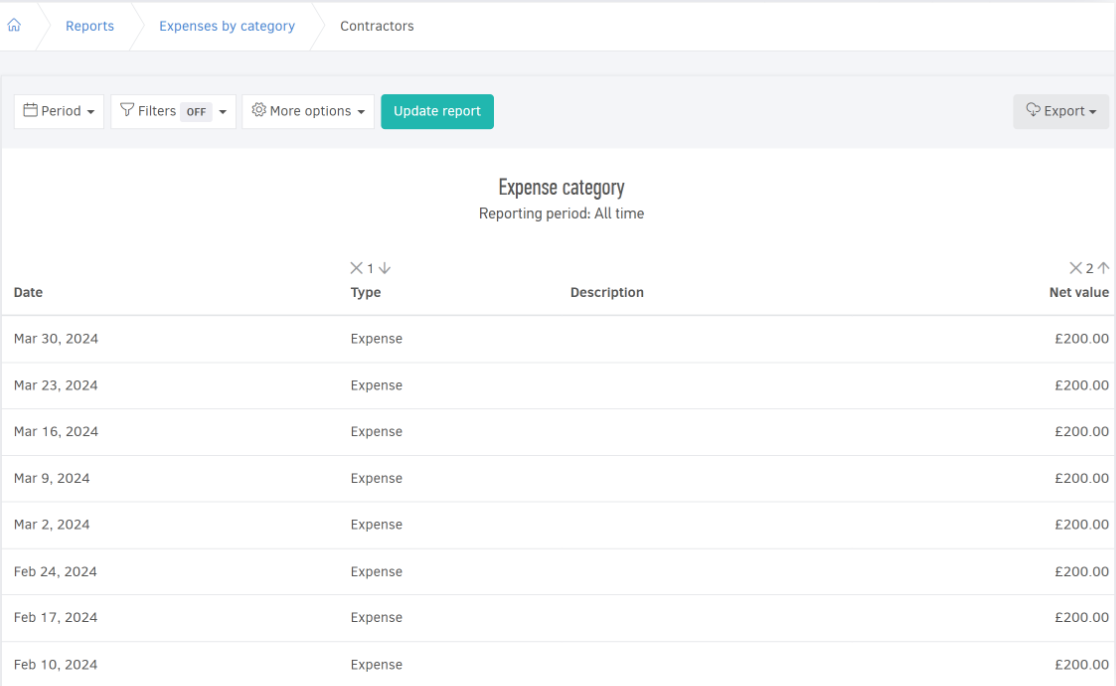
Each category includes a dedicated detailed report. You can open it by clicking the category title.
In the example below, we open the Contractors expense category, which has the highest frequency for the selected period.