


Elorus offers detailed Reports and Dashboards that reflect your business's financial data you've recorded. Both the reports and dashboards update automatically every time you make a financial transaction.
In addition to financial transactions, they also track time entries recorded within your organization and gather information related to your team's productivity.
This way, you get a complete overview of your business performance without any preparation on your part, enabling you to make decisions based on accurate data.
Overview page
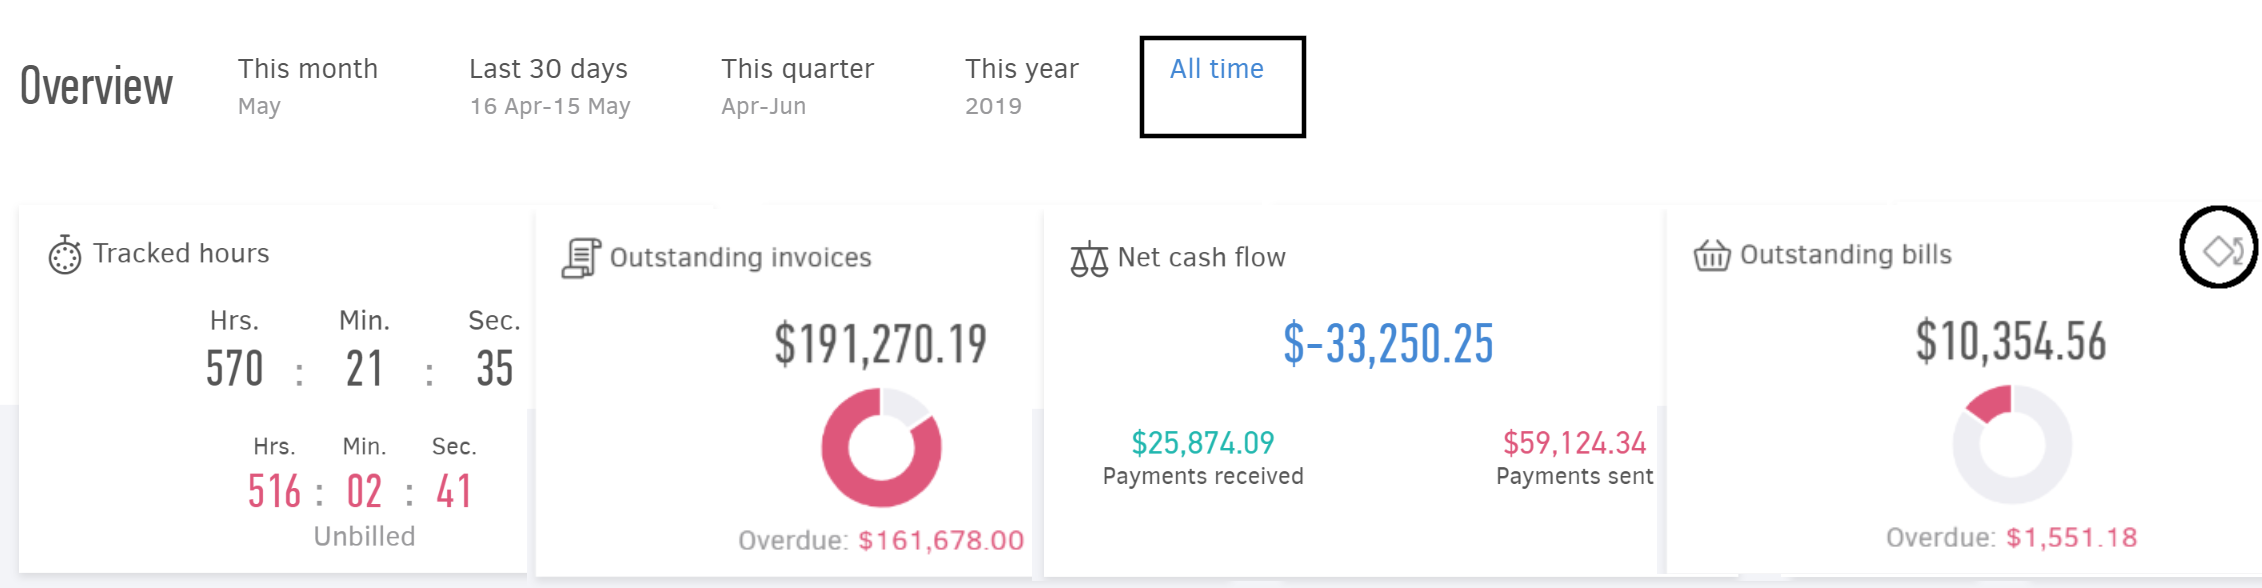
The organization overview page, your first view upon logging into the application, briefly presents key financial indicators through visual elements.
Charts
The charts display the following data:
- Revenue and expenses
- Expenses by category
- Cashflow timeline
- Tracked hours
In the example below, you can see the expenses for the past year (previous 12 months). As shown, the chart is divided based on the amount spent in each category.
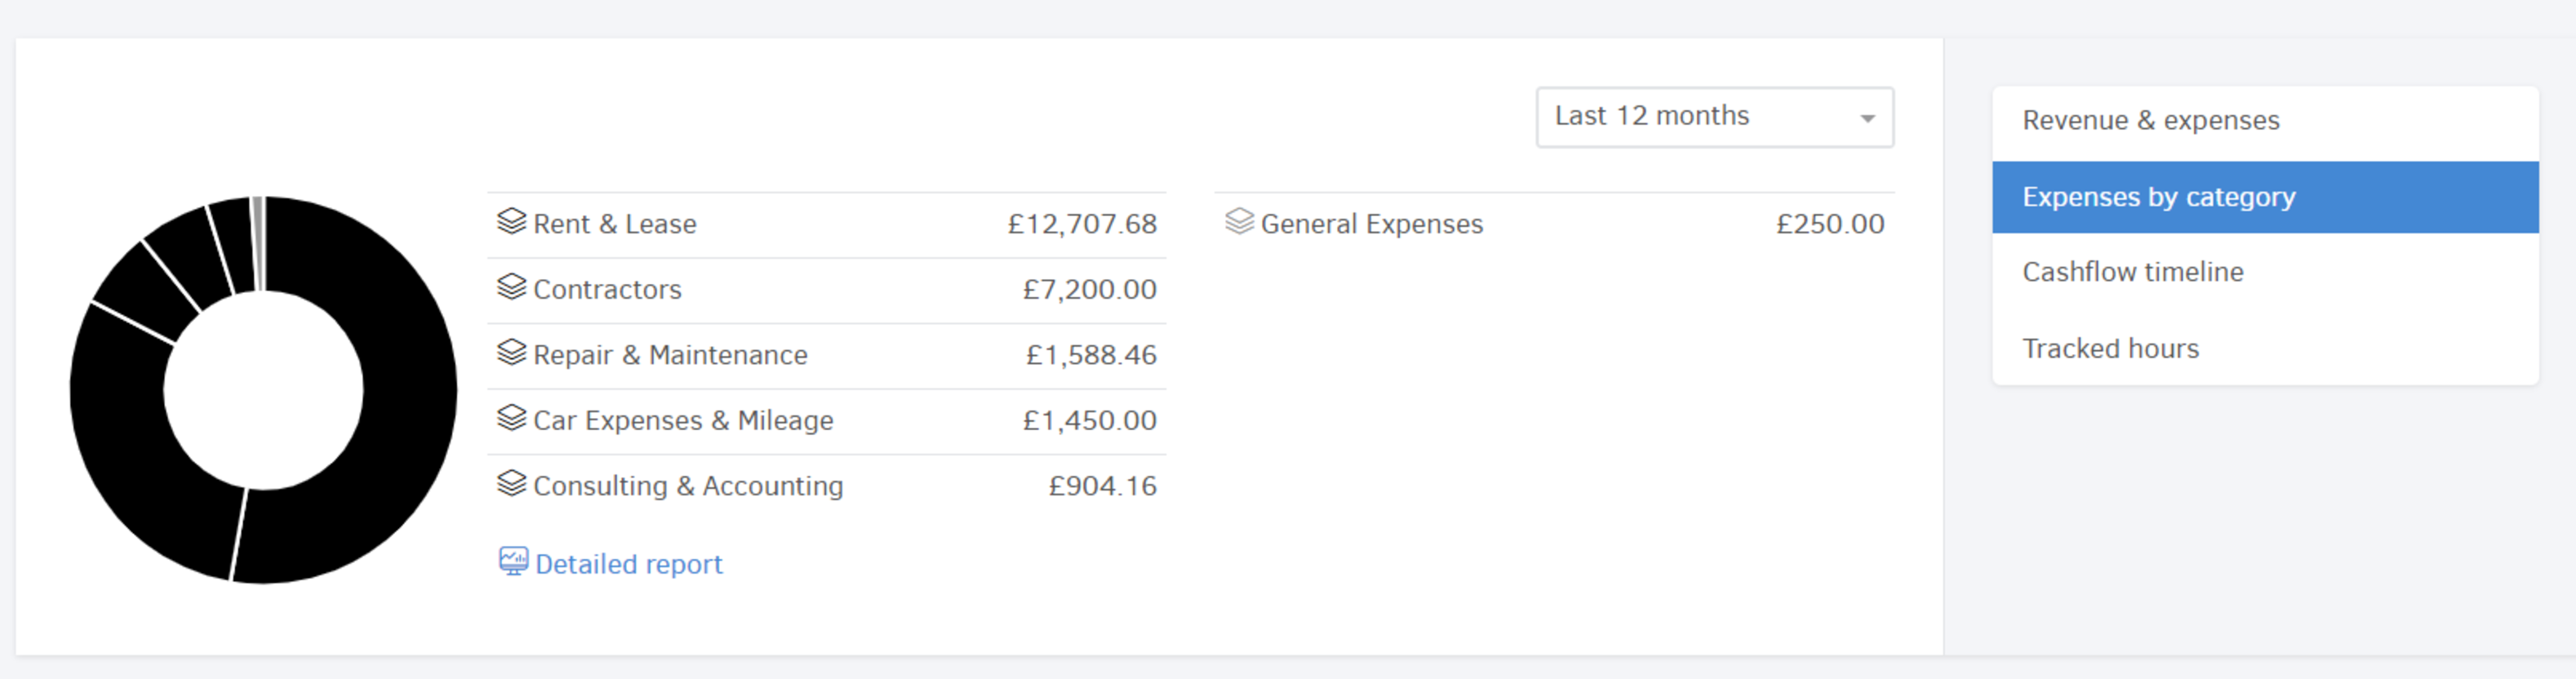
Hover over the chart to view the exact amounts.
Outstanding invoices, Outstanding bills and Client balances
At the bottom part of the overview page, you'll find three lists: Outstanding invoices, Outstanding bills and Client balances.
Types of reports
Reports are grouped into the following categories:
- Sales
- Expenses & purchases
- Time tracking
- General
- Cash flow
- Accounting
Sales
Sales reports display data derived from your invoicing activity.
Expenses & Purchases
Expenses & purchases reports show data related to your payables, either to suppliers or to other third parties.
Time tracking
Time tracking reports reflect the hours logged per project or task, distinguishing between billable and non-billable time.
General reports
General reports compile information on client and supplier balances, as well as stock movements and current stock levels.
Cash flow
Cash flow reports allow you track your company's cash, collections, and payments.
Accounting
Accounting reports provide insights into your business's profitability and tax obligations.
Dashboards
Dashboards are summary reports where data is presented in chart and graph format.
They grouped into the following categories.
- Sales dashboard
- Expenses & purchases dashboard
- Cash flow dashboard
- Team productivity
You can find more information about Reports and Dashboards in the related article.