

Every time you issue Invoices or Credit notes, Elorus automatically records the activity and displays it in the Sales Reports.
Elorus provides three types of sales reports:
- Sales detail
- Sales by client
- Sales by tracking category
To access these reports, go to the main menu and click Reports > All reports.
For more details on managing reports, visit the related article.
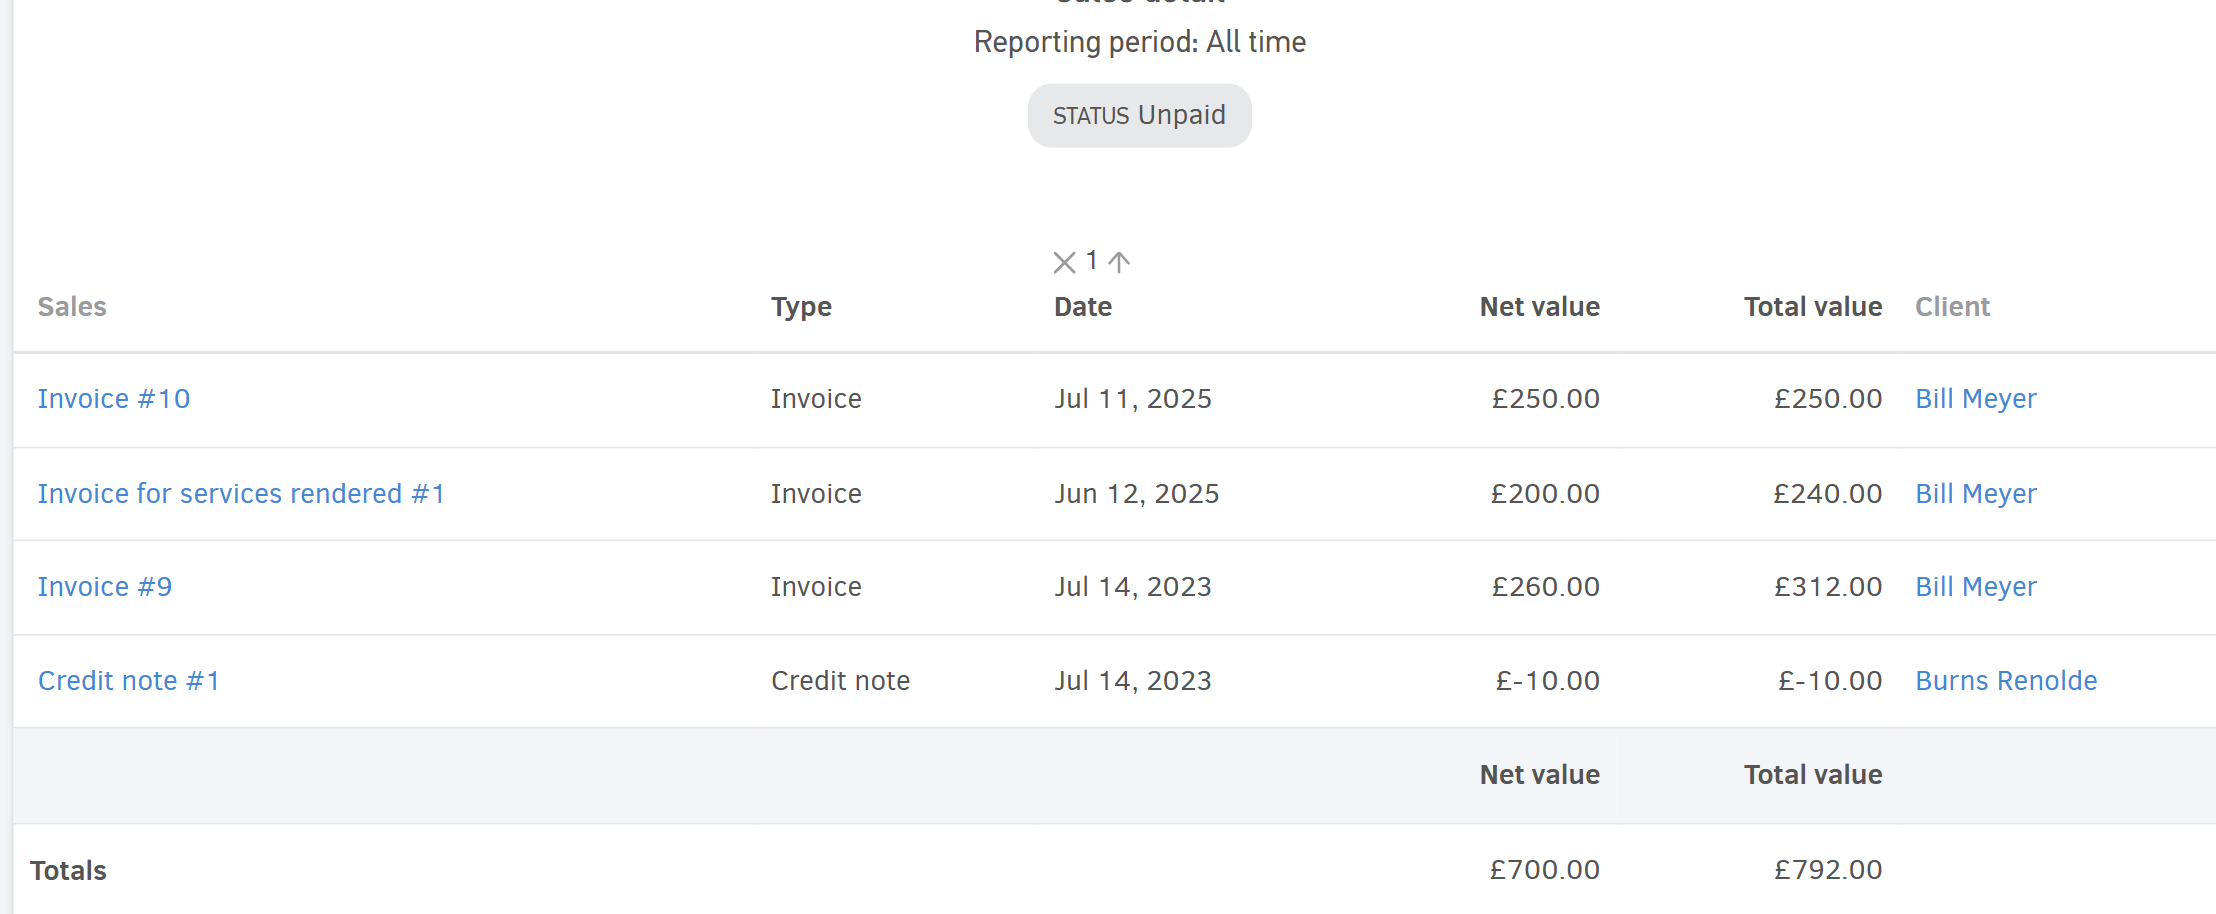
Sales detail
The Sales detail report provides a table with full information on all Invoices and Credit notes issued during the selected period.
For quick access, go to Reports > Detailed sales.
You can set Period and apply Filters.
Below is an example:
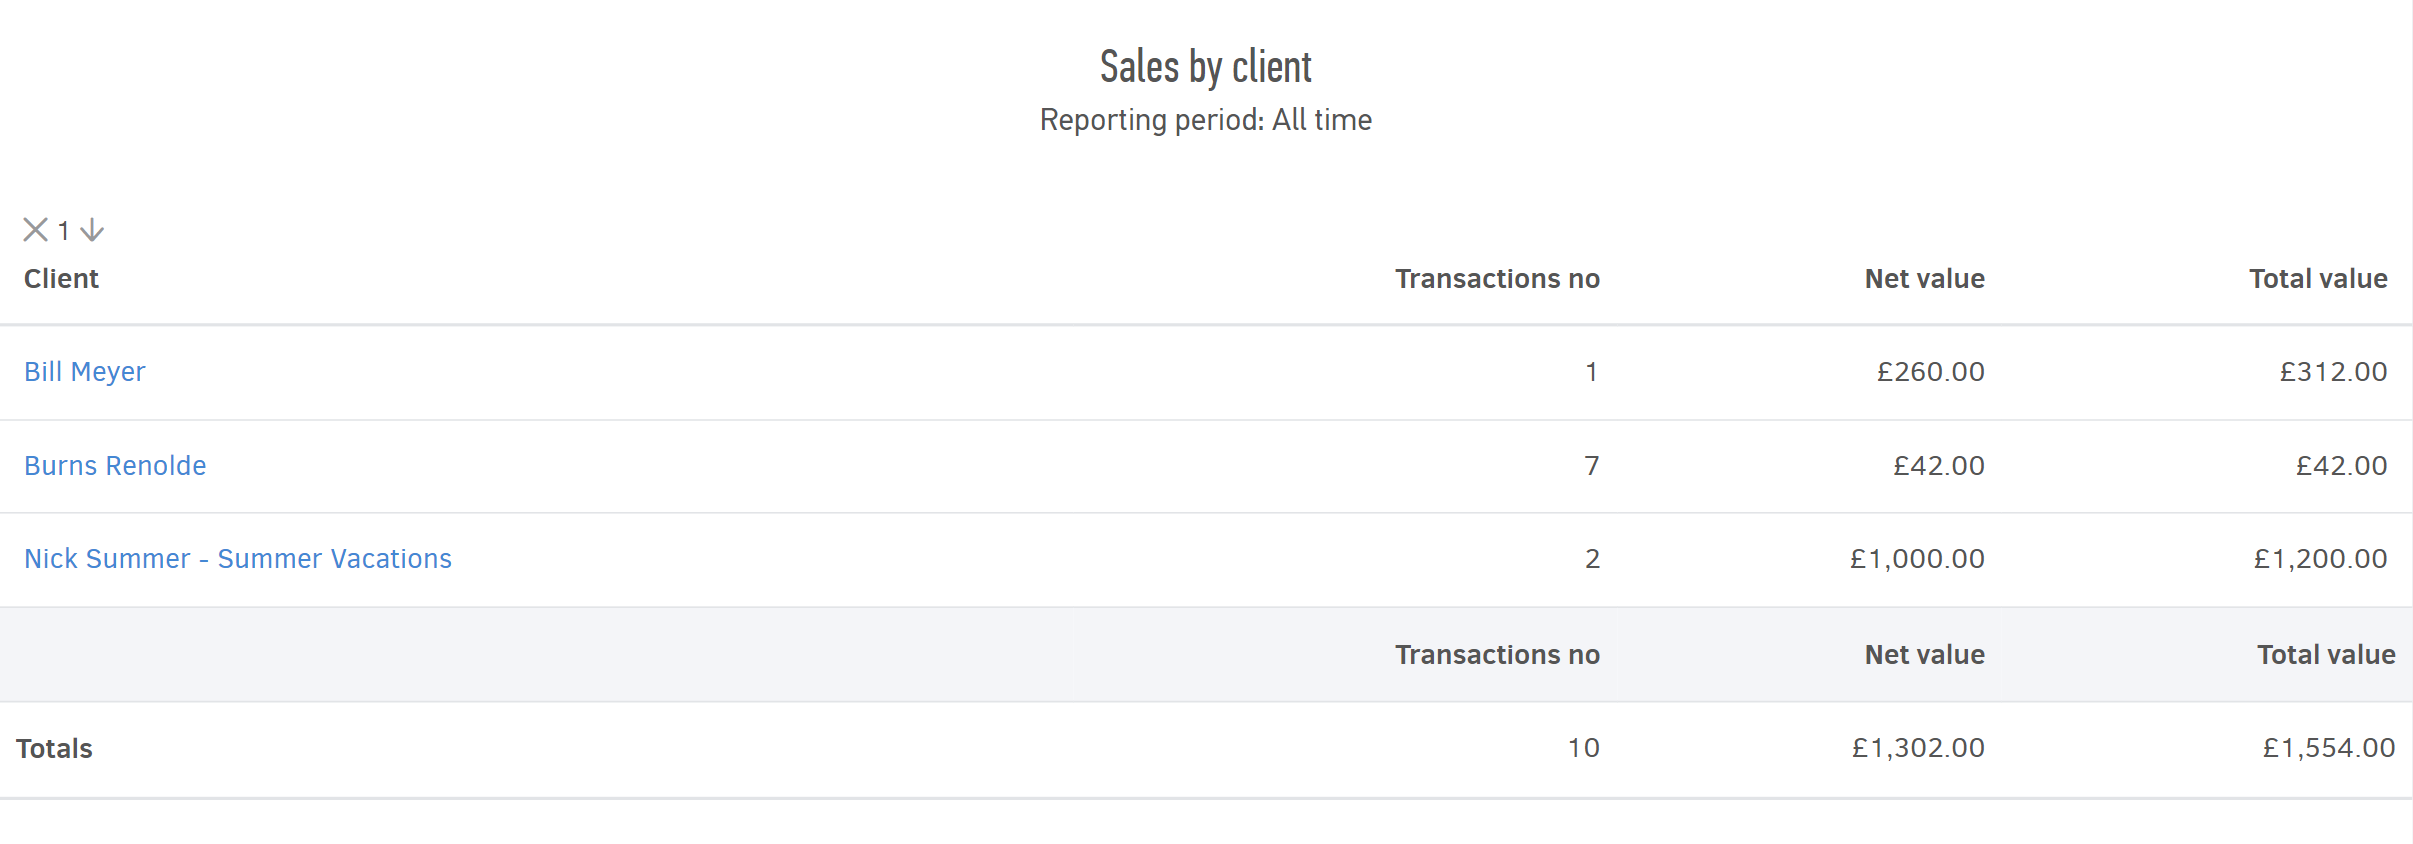
Sales by client
This report shows your sales data grouped by client. By clicking on a client’s name, you can see additional details such as:
- Number of transactions
- Net and final amounts
- Client contact information
To refine results, you can set a specific Period, apply Filters, and customize the Columns through the Options menu.
Sales by tracking category
This report shows your sales data based on the categories you have created.
For example, if you have created a category called Sales by region with options such as North, South, West etc., the report will break down total sales per region for the selected period.
![]()
You can set a Period, apply Filters, and customize the Columns through Options.
As with other reports, you can click on any result row to drill down into the Sales detail report, where you’ll find the full list of transactions for that category.
If multiple categories are applied to sales, you can switch between them using the report tabs.
![]()
Void documents (both invoices and credit notes) and those in Draft status are not included in sales reports.