Team
- 15 May 2024
- Contributors


Team
- Updated on 15 May 2024
- Contributors
Article summary
Did you find this summary helpful?
Thank you for your feedback!
This specific report allows you to track the total recorded hours your team has dedicated to assigned projects. Thus, you can gather insights on how your team members distribute their Hours of work per project, per task, and per client.
Elorus displays this information in a vertical layout, either by user or as a team total, according to the time period you select. To view and utilize the data from the report, select Team from the main menu.
Period selection

Choose the week or month of interest using the arrows or the calendar.
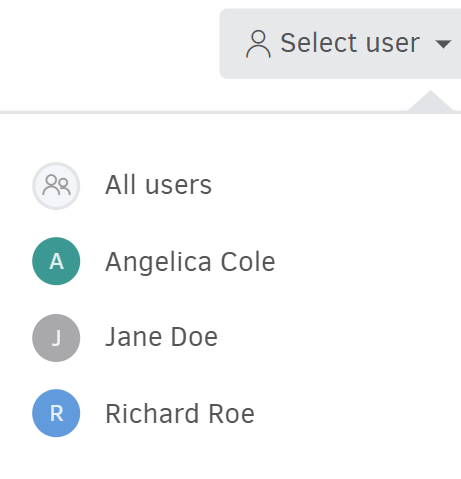
User Selection
The results on the charts are displayed by user or as a team total (all users), depending on your selection from the list.
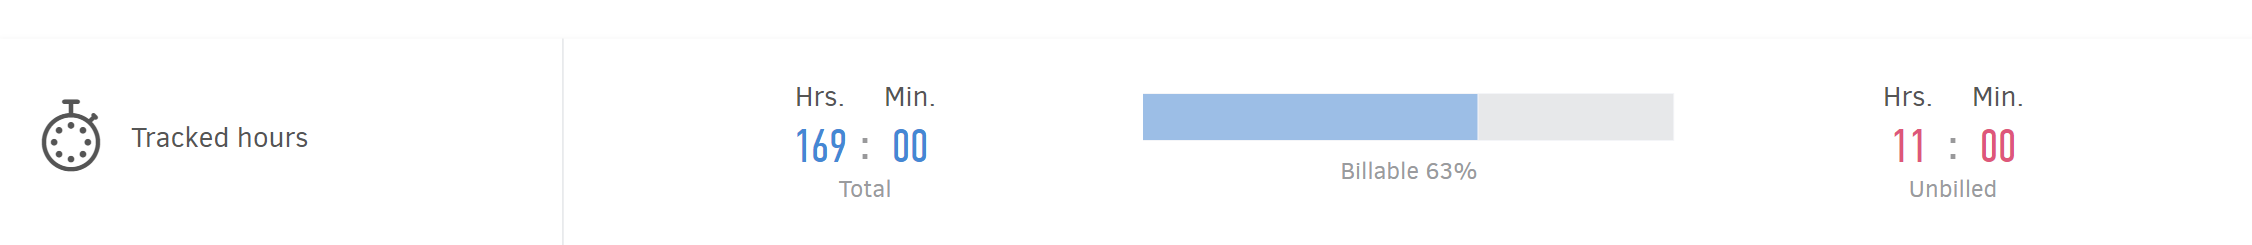
Overview
When selecting a user, Elorus displays at the top of the page the total of Tracked hours, the percentage of Billable hours, and how many of them are Unbilled.
Progress chart
The chart allows you to see how hours are distributed across projects-clients and tasks per week or per day, depending on the time period you have chosen. You can view the Total time or choose between Billable time and Non-Billable time.
Important!
For a more manageable overview, the charts only display the top ten results in each category. All other data are grouped under the "Other" category.
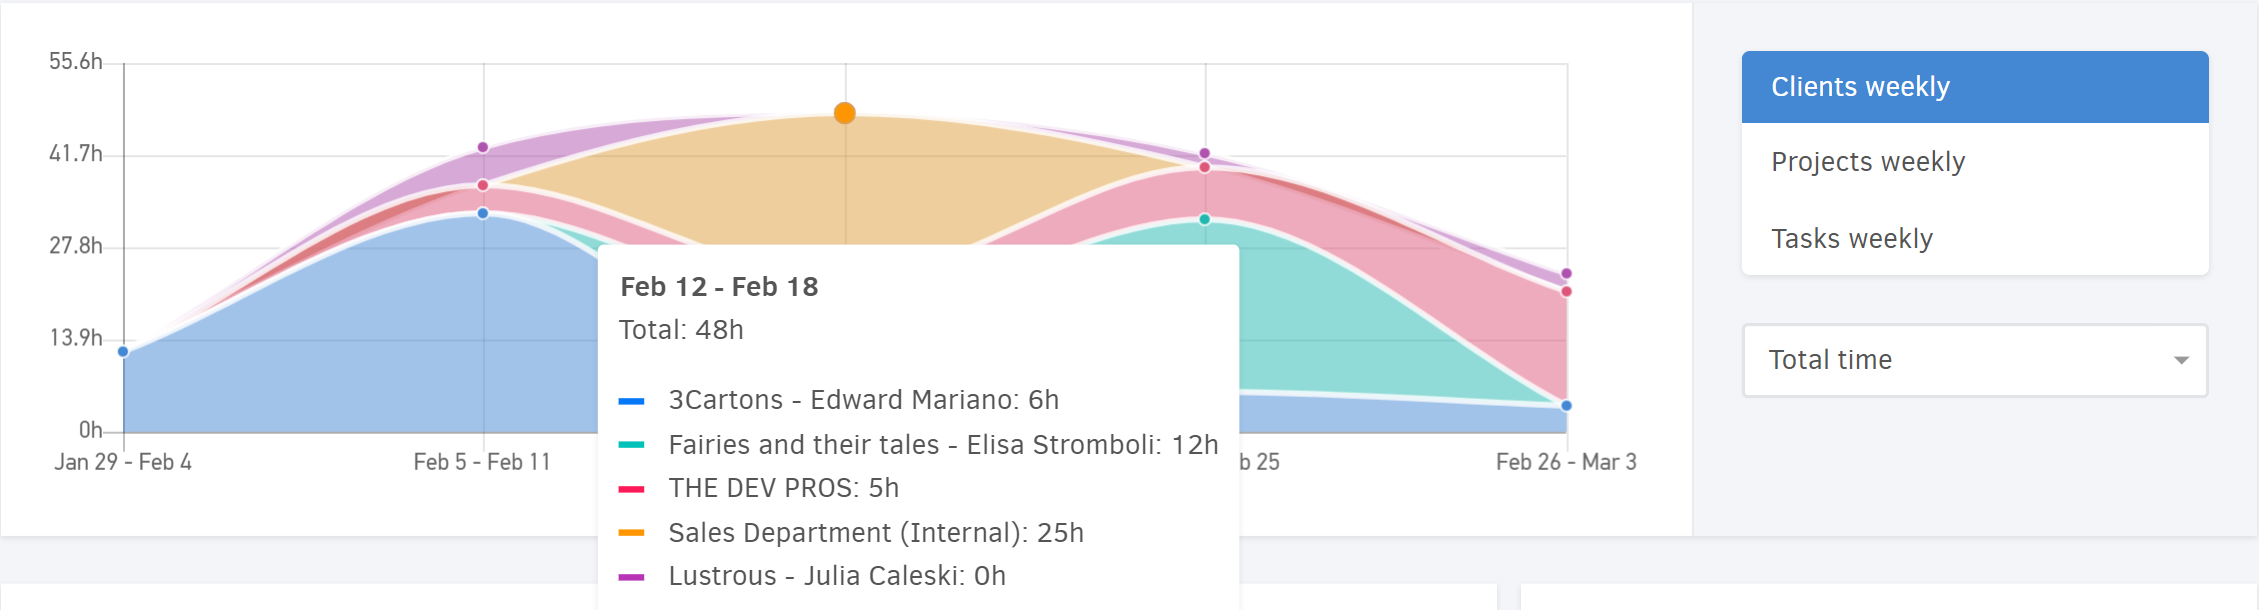
Clicking on one of the dots on the chart shows the time spent per client/project/task.
Hours per client/project/task
Below the progress chart, three different tabs display the total recorded hours grouped by client, by project, and by task.
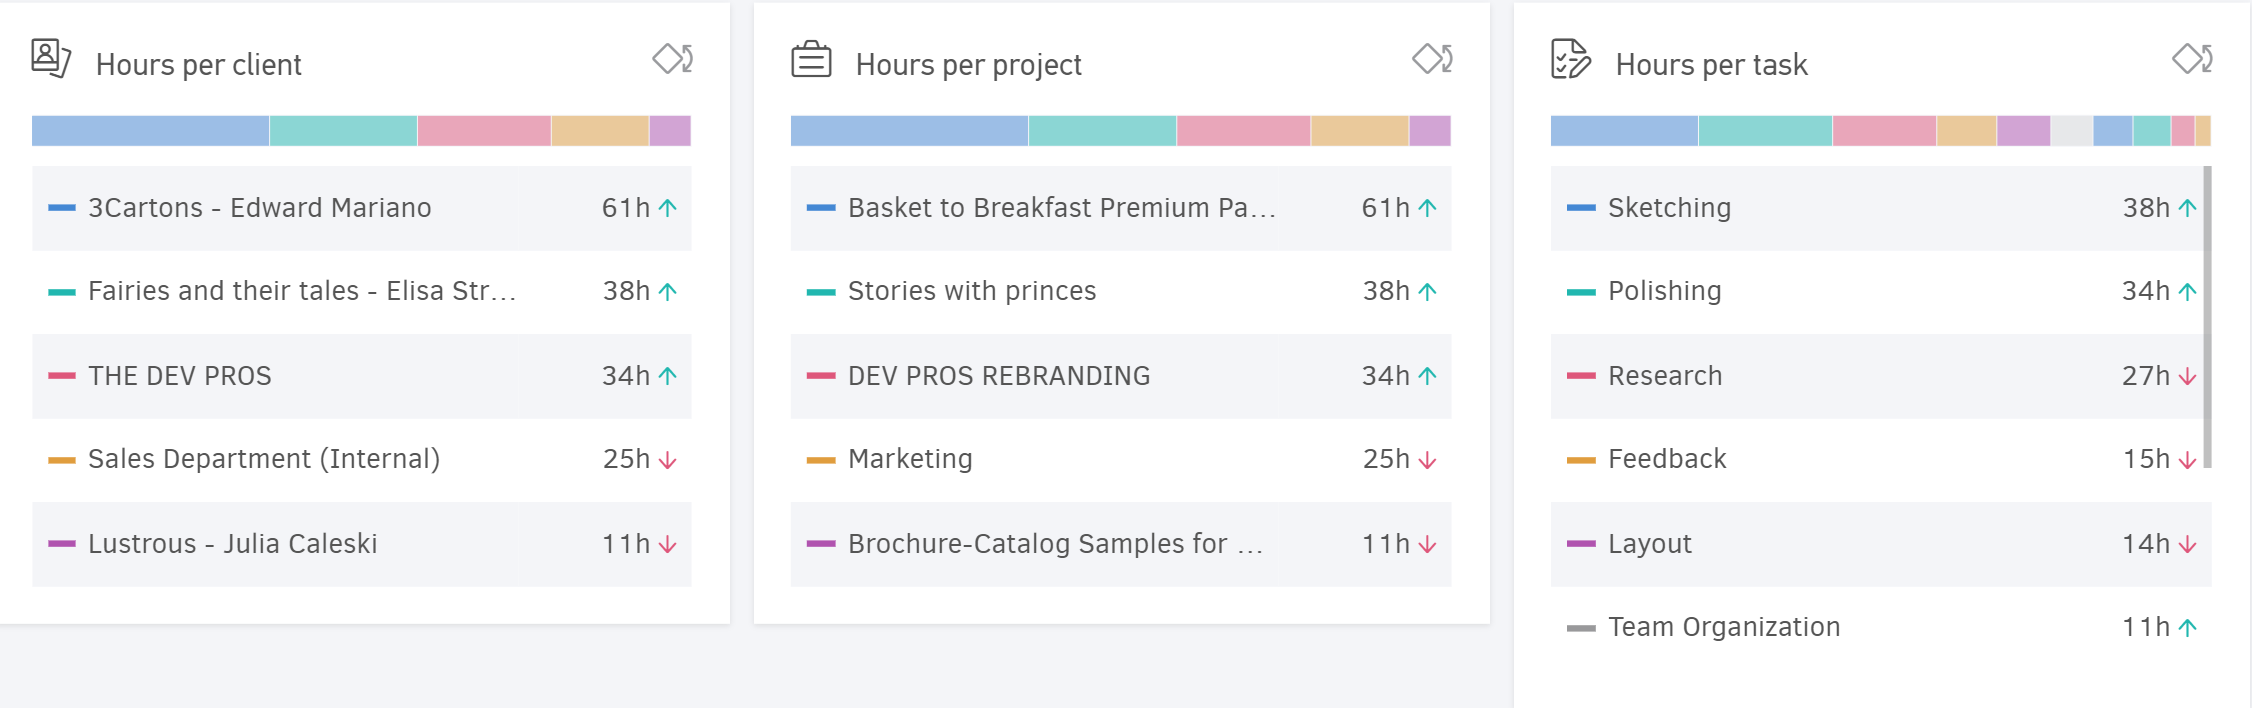
Hours per client: The hours your team or user has recorded for a client, for whom one or more projects are being carried out.
Hours per project: The working hours for each project the user has worked on.
Hours per task: The hours recorded for each specific task within a project.
Financial outcomes of time
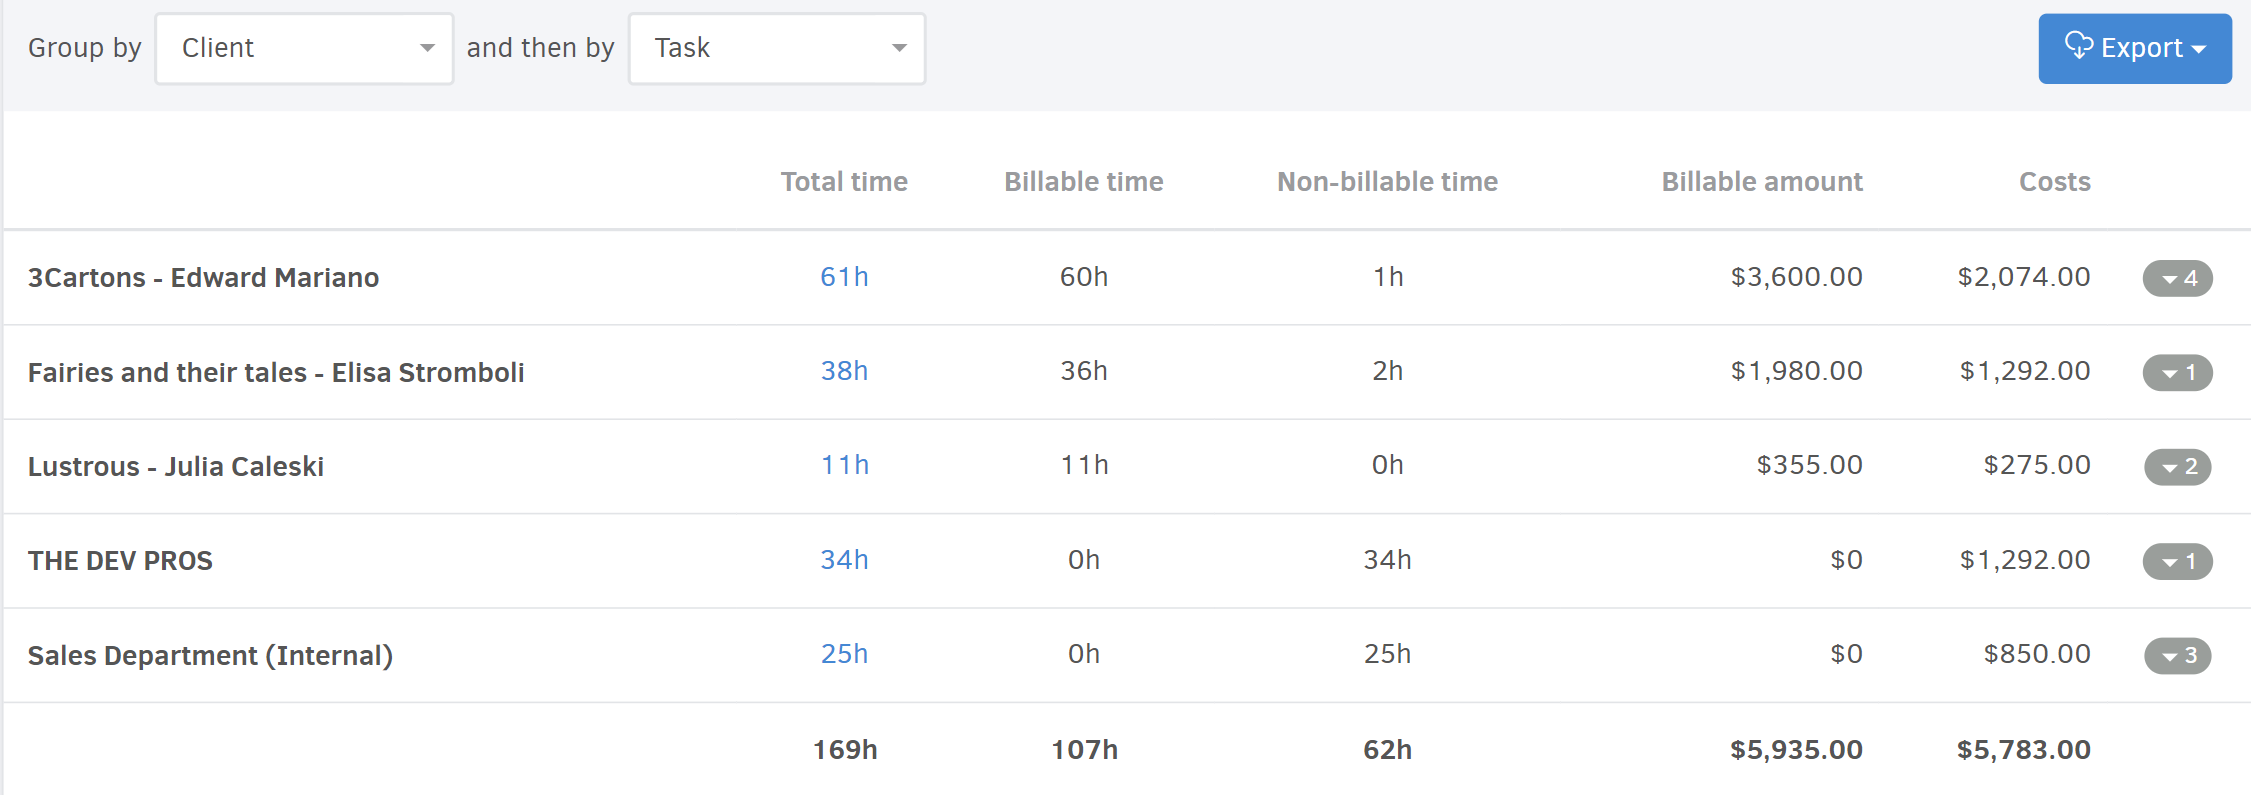
At the bottom of the page, you can see how the recorded times translate into billable amounts. Concurrently, you can monitor the cost these times have incurred for your business. This way, you get an idea of the profitability of the projects and tasks you have undertaken, as well as the efficiency of your team members, i.e., the users.
Combine any two of the above parameters for Grouping (primary and secondary). In the image above, the times recorded per client and per task performed for that client are displayed.
Clicking on any time summary takes you to the corresponding time report (detailed time recordings) to see detailed time logs.
Was this article helpful?