
General reports give you access to key financial data for your business, organized into the following categories:
- Client balances
- Client statement summary
- Supplier balances
- Product/Service activity
- Product stock
To access these reports, go to Reports > All Reports and select the one you need.
Client balances
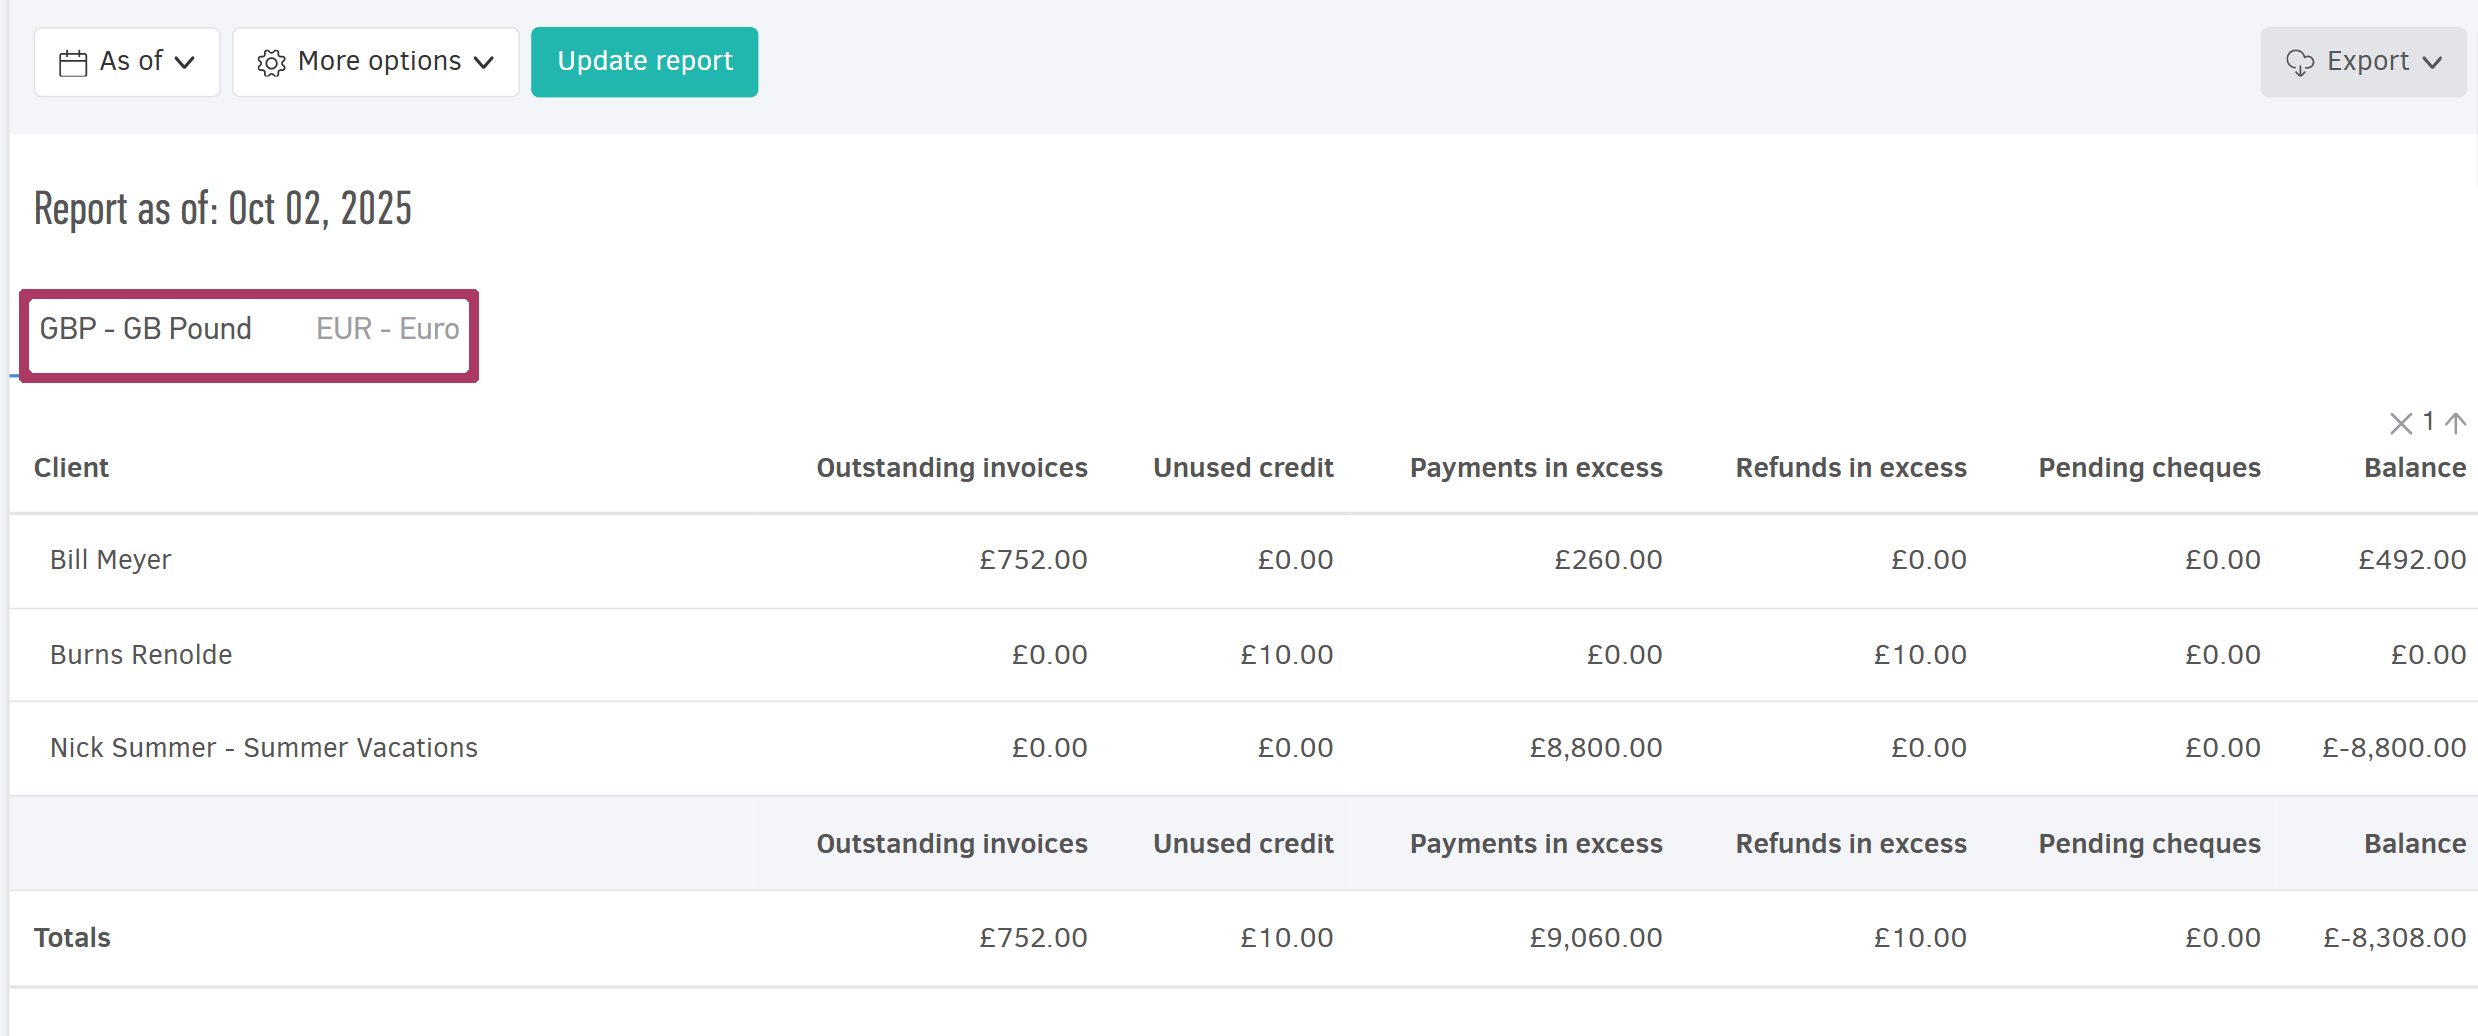
The Client balances report provides a full summary of your financial obligations to and from clients (who owes you, and whom you owe).
For quick access, go to Reports > Client balances.
From the More options field, you can choose which of the following columns to display in the report:
- Client
- Tax ID
- Outstanding invoices
- Unused credit
- Payments in excess
- Refunds in excess
- Balance
If you work with Cheques, a Pending cheques column is automatically enabled.
Click on a client’s name in the list to view their full record in the Contacts menu.
If you invoice in multiple currencies, separate tabs will appear, one for each currency, so you can view results by currency.
Client statement summary
The Client statement summary report is particularly useful, as it allows you to view your customers’ charges, credits, and balances in a consolidated manner for a specific period. More specifically, it provides a breakdown of the charges and credits recorded before the selected time period, the charges and credits recorded during the selected time period, as well as the progressive charges and credits.
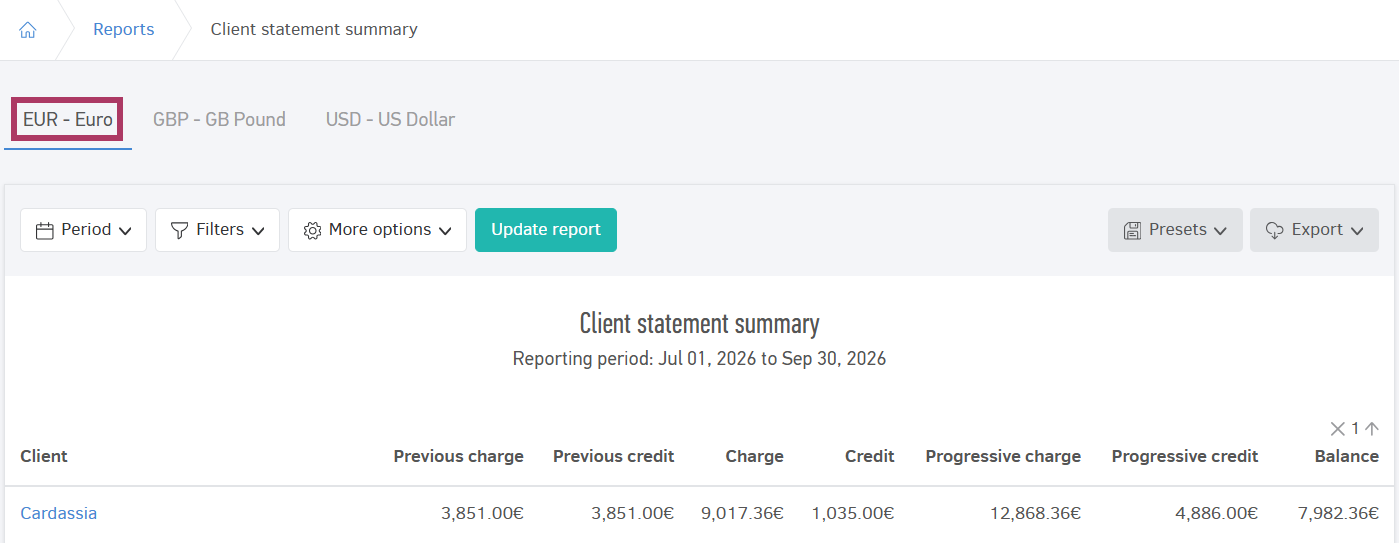
At the top of the page, all available currencies that have been used across your contacts are displayed, allowing you to view the balance for each currency separately.
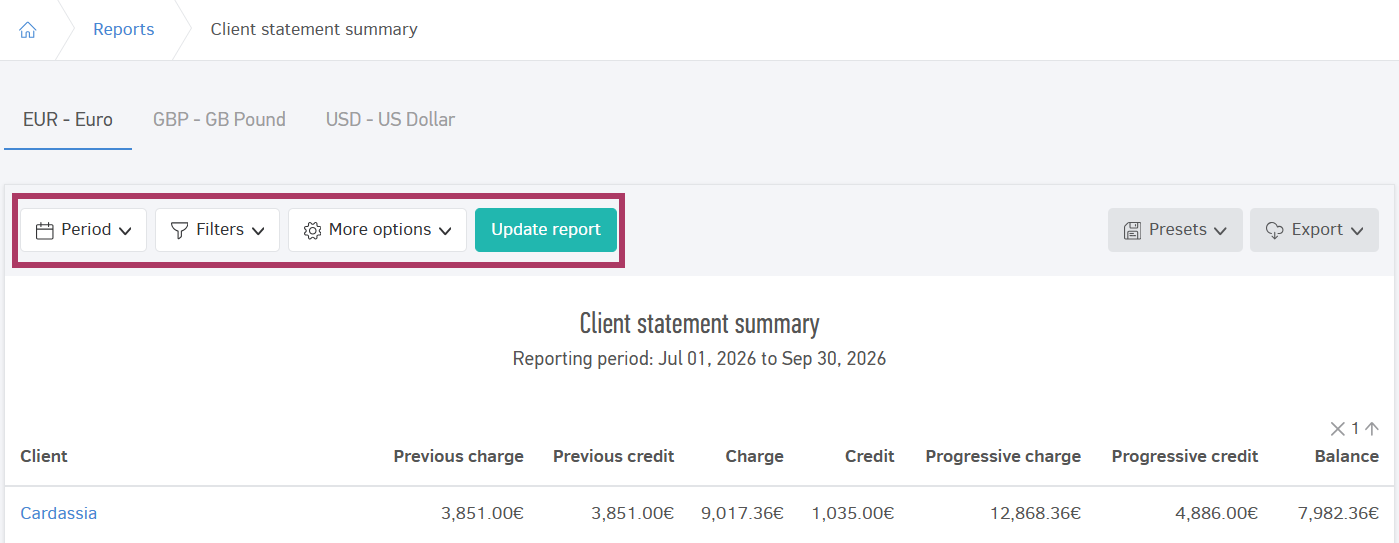
In the Period, Filters, and More options fields, you can define the reporting period, filter the results based on categorization, and add or remove columns. On the right-hand side of the page, you can export the report as an Excel or PDF file, just as with the other reports.
Below, we provide an example of the report for the period from July 1st to September 30th, in order to explain how each column should be interpreted.
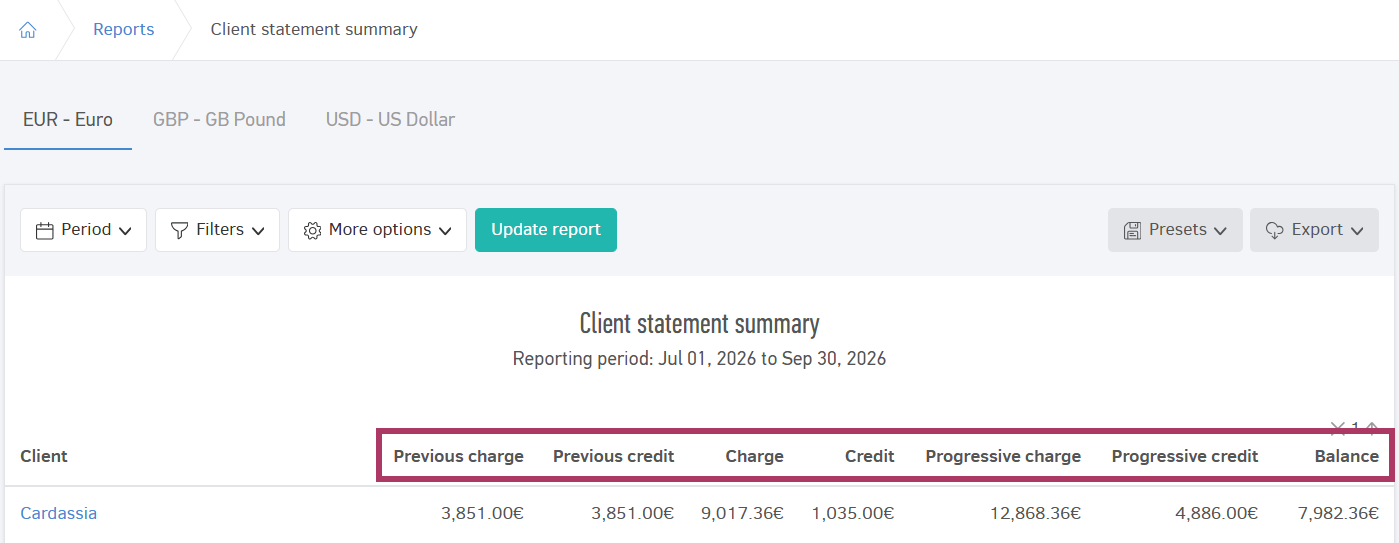
The Previous Charge and Previous Credit columns display the total charges and credits recorded before the report start date, i.e. from the customer’s first recorded charge and credit up to and including June 30th.
These amounts correspond to the customer's client statement for the same period.
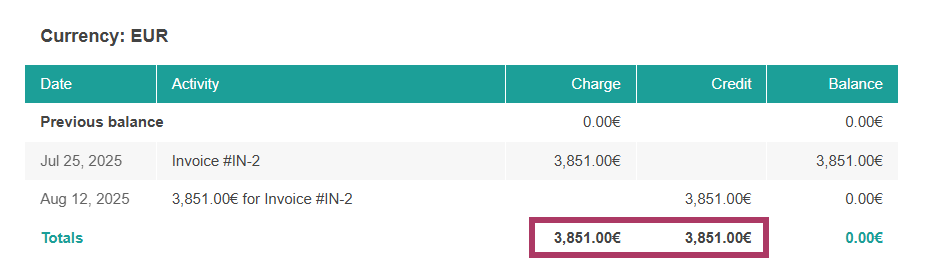
The next two columns show the totals for Charge and Credit for the reporting period, i.e. from July 1st to September 30th. The same values are also shown in the customer's client statement for the aforementioned period.
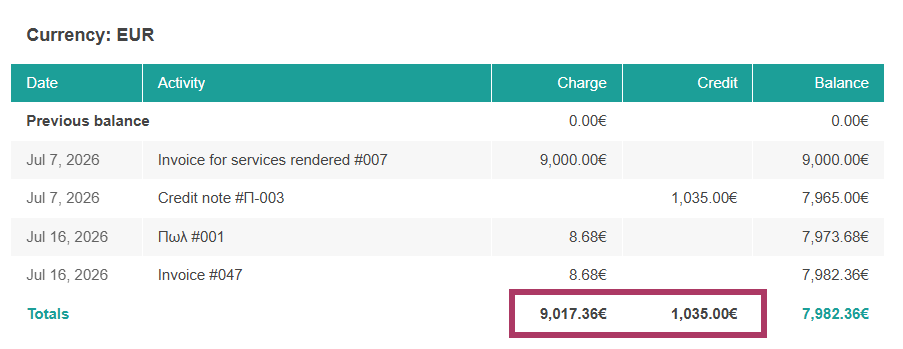
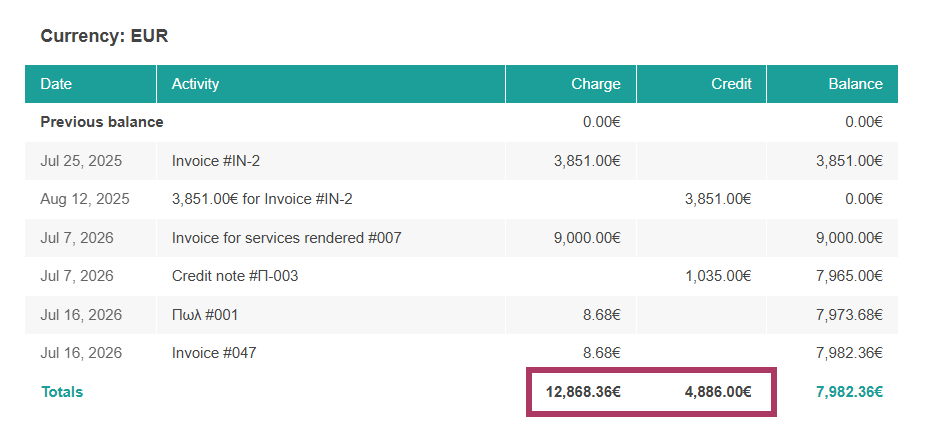
The Progressive Charge column adds together the amounts in the Previous Charge and Charge columns. According to the example above, the amounts are calculated as follows:
€3,851.00 + €9,017.36 = €12,868.36
The Progressive Credit column adds together the amounts in the Previous Credit and Credit columns.
€3,851.00 + €1,035.00 = €4,886.00
The amount shown in the Balance column is calculated by subtracting Progressive Credit from Progressive Charge.
€12,868.36 - €4,886.00 = €7,982.36
The above amounts are also shown in the customer's client statement when the corresponding period is selected, i.e. from the customer’s first recorded charge and credit up to September 30th.
Clients for whom no activity (charge or credit) has been recorded are not included in the report.
Supplier balances
Similar to Client balances, the Supplier balances report shows what your business owes to suppliers.
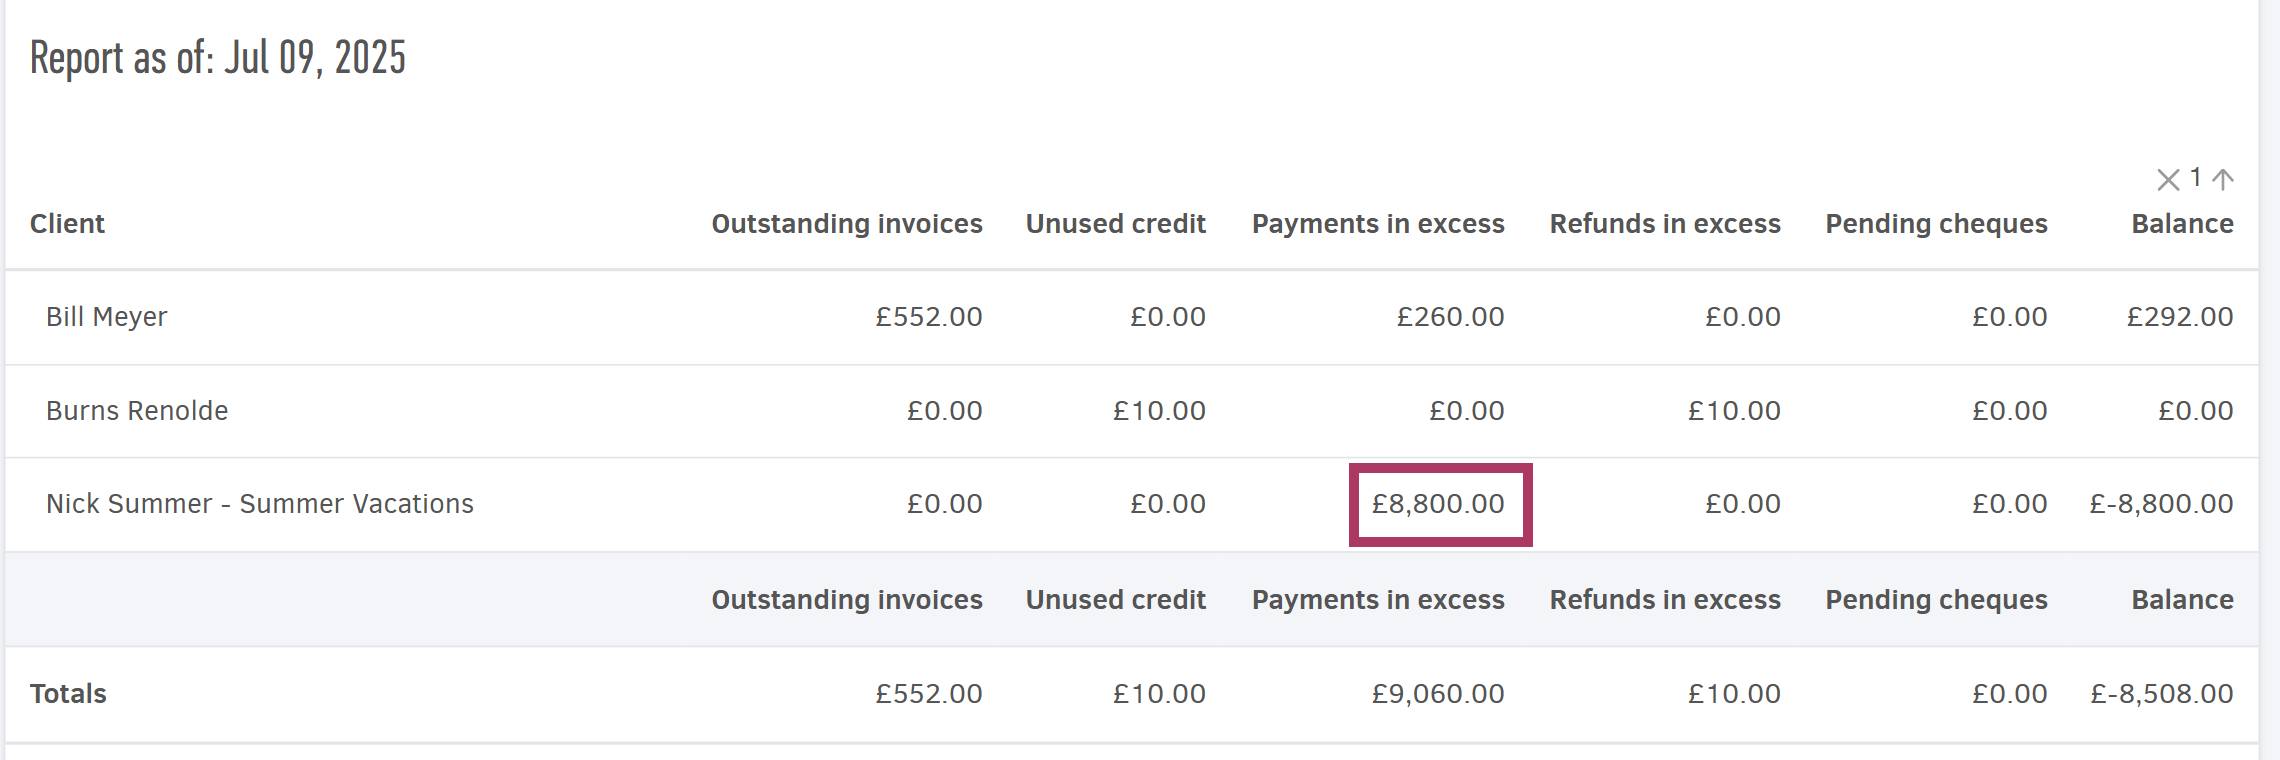
In both the Client balances and Supplier balances reports, a negative balance means that either:
- You owe the client/supplier, or
- The client/supplier has an overpayment or refund in excess.
Product/Service activity
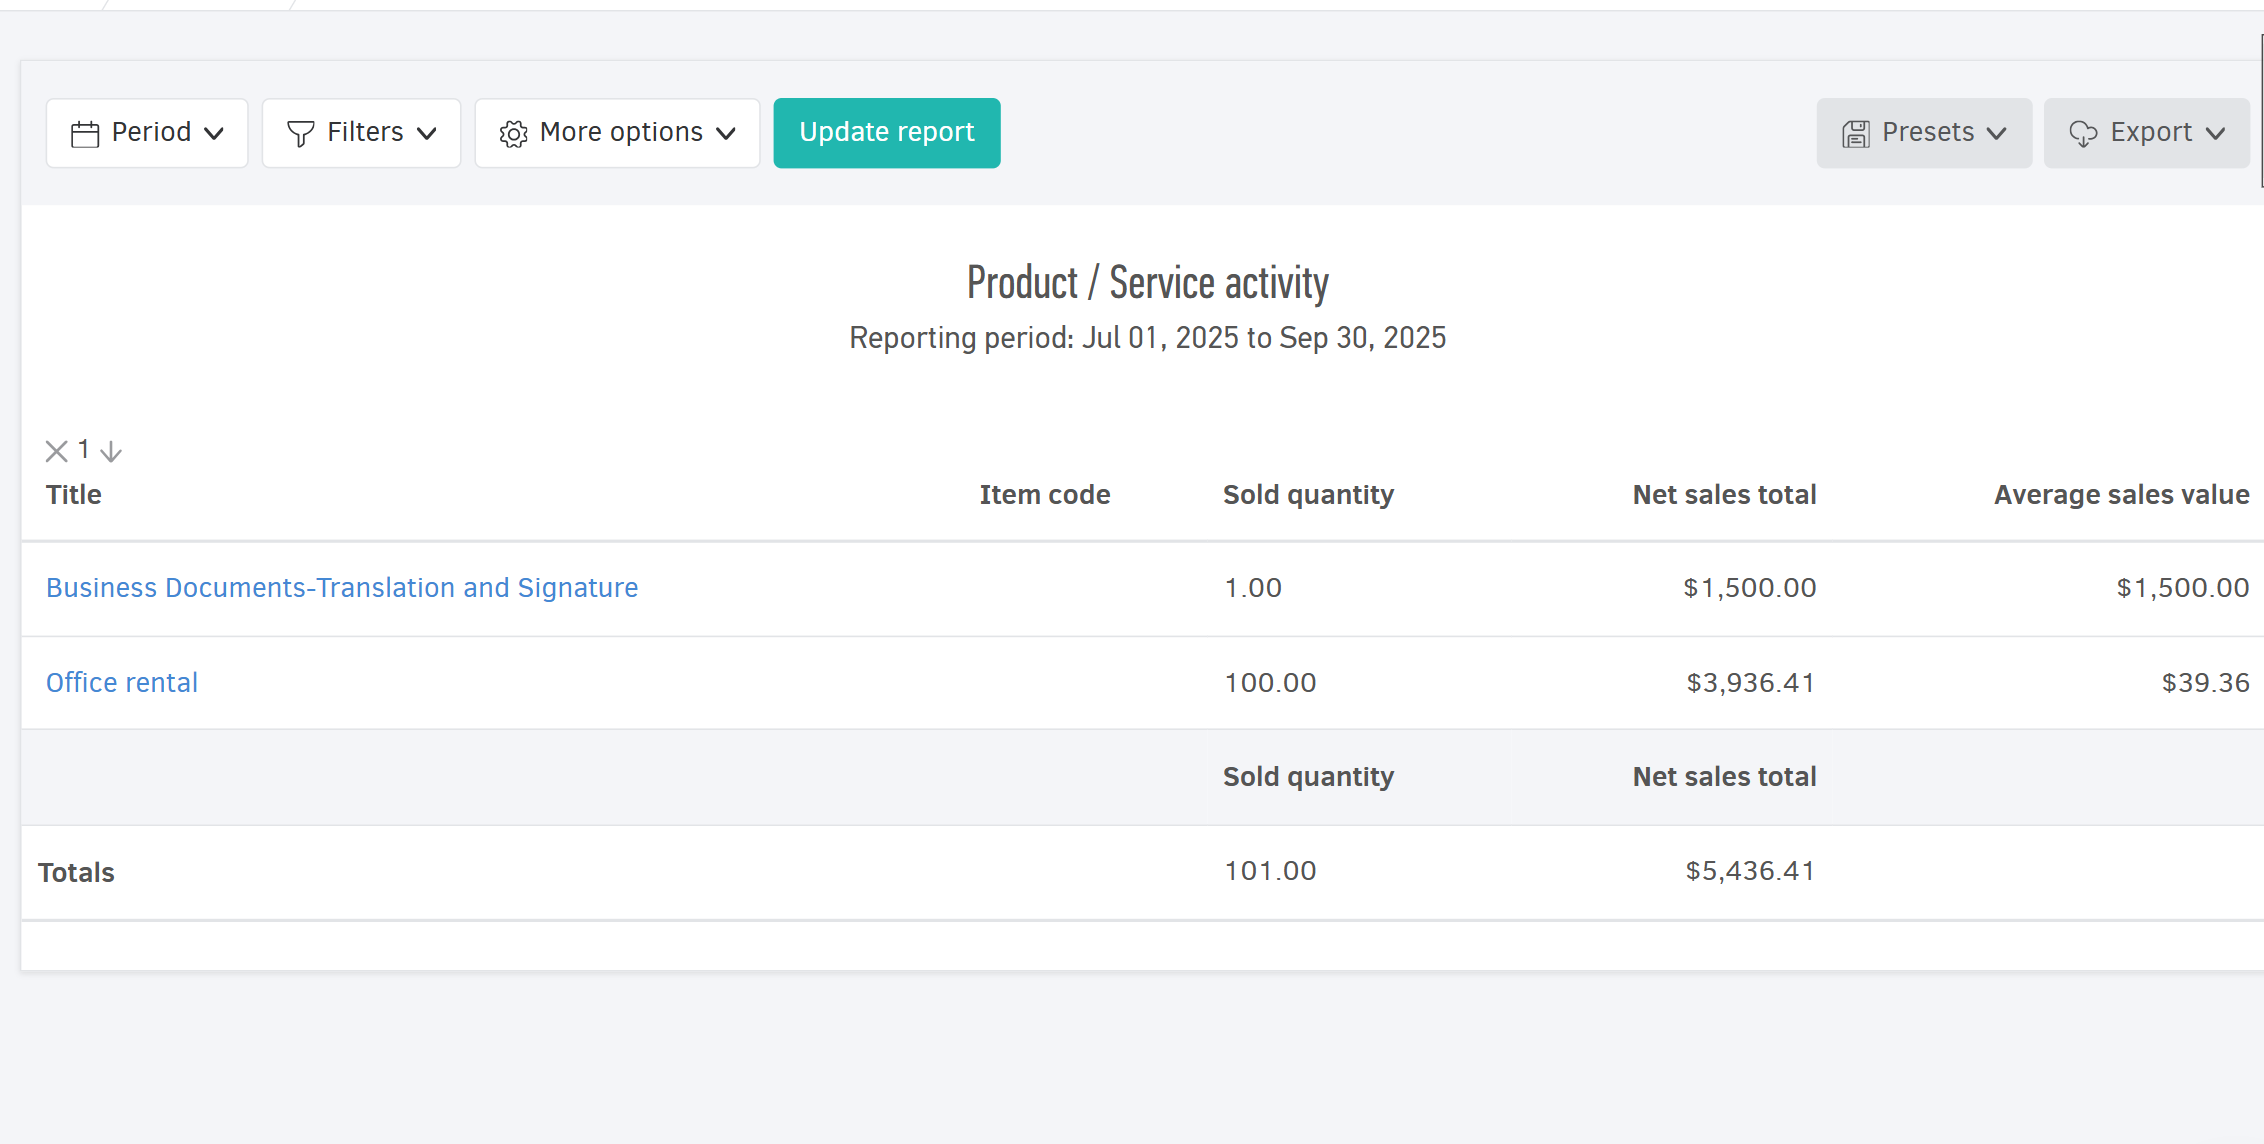
The Product/Service activity report helps you track the sales and purchases of items you've registered in your stock:
- which products/services are your best and worst sellers,
- metrics like net sales and purchase values, average sales/purchase price, and more.
For quick access, go to Reports > Product/Service activity.
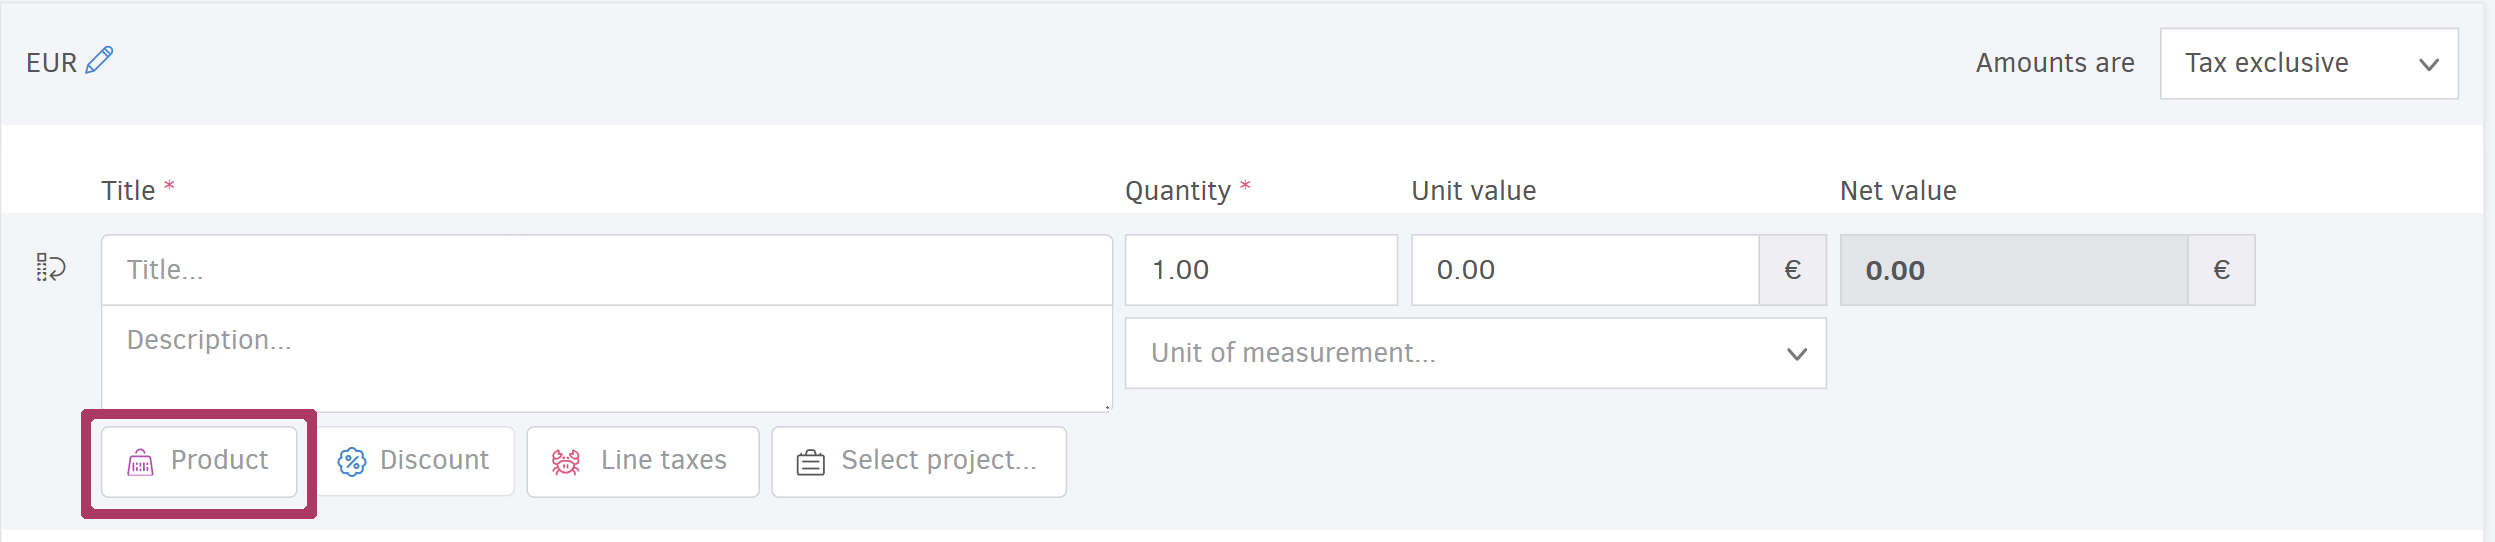
To generate accurate results in this report, you need to select the product or service when invoicing or entering an expense or bill, by clicking the Product button.
Product stock
Use the Product stock report to monitor your stock levels per Warehouse, especially useful for tasks like year-end inventory. You can set a specific reporting date using the As of field.

From the More options field, you can choose which of the following columns to display:
- the item code
- the available stock
- the average purchase value
- the stock value
If any tracking categories apply to products/services, they’ll appear here.
From the Filters menu, you can filter results by: Stock status (In stock or Out of stock)* and Record status (Active or Archived).